
Abstract
In recent years, ophthalmologists widely depend on optical coherence tomography (OCT), which is an objective, reliable, and repeatable structural test for both early diagnosis of glaucoma and detecting progression of the disease. Using this technology, it is now possible to take measures of various anatomic structures and layers of the optic nerve head, peripapillary retinal nerve fiber layer, and macular area. Although OCT has these powerful capabilities in general, anatomical variations, artifacts related to the ocular pathologies, and issues with image acquisition can be present in up to one-third of scans. These anatomical variations and artifacts can be misleading to an interpreter and may lead to erroneous conclusions. This review focuses on the realization and prevention of most common anatomical variations and artifacts observed with OCT imaging. The concepts of floor effect and red and green diseases are also investigated.
Keywords: Optical coherence tomography, OCT artifacts, OCT anatomic variations, red disease, green disease
Introduction
Optical coherence tomography (OCT) has been widely used in recent years for both the diagnosis and follow-up of glaucoma, as well as in other areas of ophthalmology.,,, When initiating treatment for patients with glaucoma, suspected glaucoma, or ocular hypertension, ophthalmologists generally base their decisions on OCT results. As with any newly introduced diagnostic method, it may take time to understand the limitations and sources of error of OCT. Evaluating results with knowledge of these limits and sources of errors will make OCT results more reliable in the diagnosis of new cases and analysis of progression.
For a sound evaluation of OCT data, physicians should not limit themselves to the colored images, tables, or maps that compare patient data with the normative database. The classifications in these images, tables, and maps are based on the manufacturer’s normative database and are open to various sources of error. For this reason, when evaluating OCT reports the physician should examine en-face images, temporal-superior-nasal-inferior-temporal (TSNIT) profiles, and the patient’s unprocessed scan results to ensure accurate data analysis. Knowing potential sources of error is critical at this stage to be able to make a correct decision.,,, This is the only way we can distinguish anatomical variations and artifacts from true glaucomatous damage. Because retinal nerve fiber layer (RNFL) thickness can vary by race, this must also be considered starting from patient registration.
Overlooking OCT artifacts can cause patients who actually have glaucomatous damage to be evaluated as normal (i.e., false-negative diagnosis) or conversely, lead to false-positive diagnosis of individuals without glaucoma. False-positive diagnoses can lead to years of unnecessary treatment and follow-up. In addition to the adverse effects and expense associated with treatment, being diagnosed with a potentially blinding condition can cause patients serious psychological distress.
The aim of this review is to examine common OCT artifacts and anatomical variations that can lead to misdiagnosis and explain how we can correct these errors in cases where they may occur. The most widely used OCT images are those of the Cirrus HD-OCT (Carl Zeiss Meditec, Dublin, CA, USA) and Spectralis OCT (Heidelberg Engineering Inc., Heidelberg, Germany) instruments.
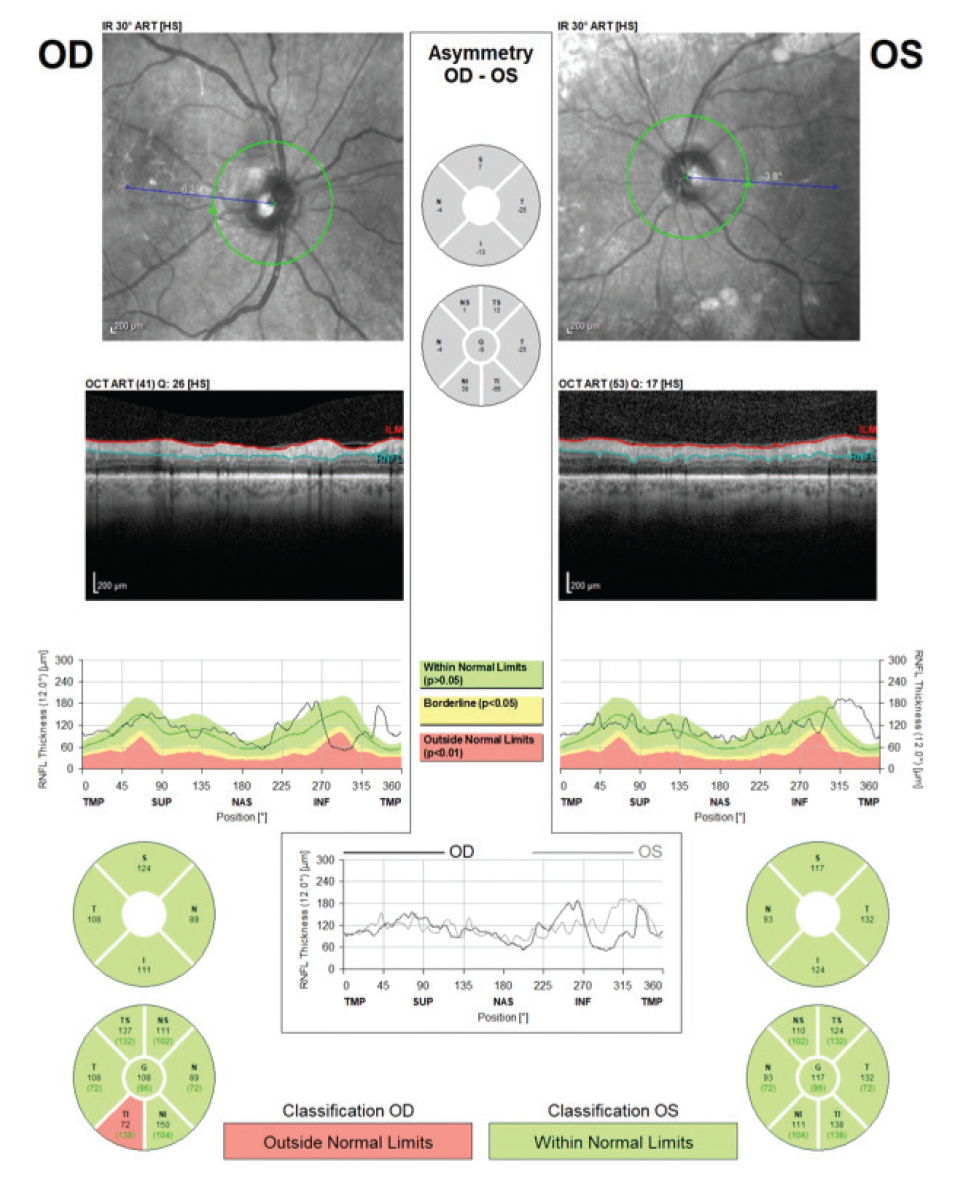
RNFL: Retinal nerve fiber layer, OCT: Optical coherence tomography
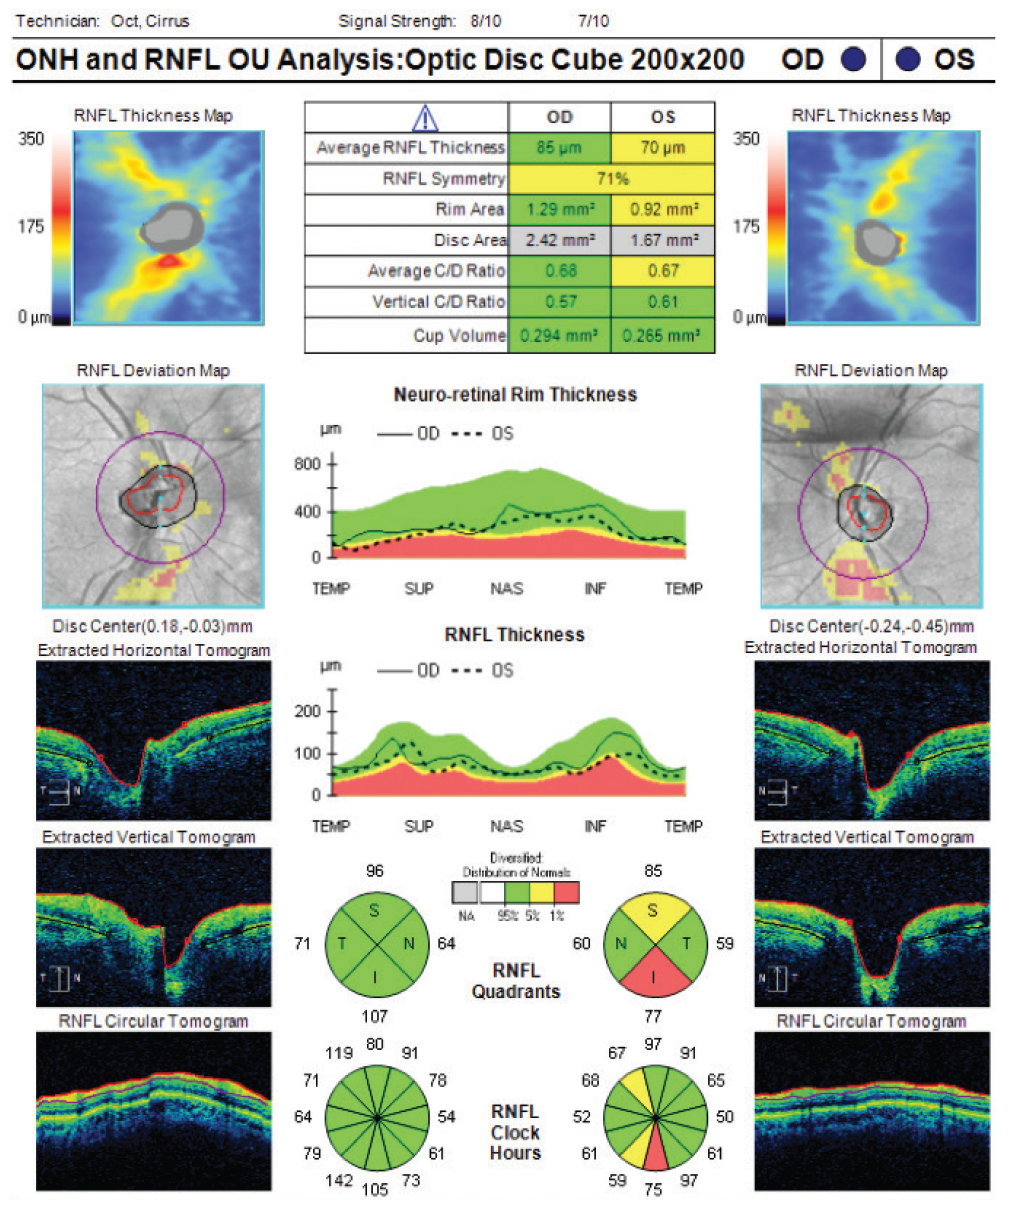
RNFL: Retinal nerve fiber layer, OCT: Optical coherence tomography
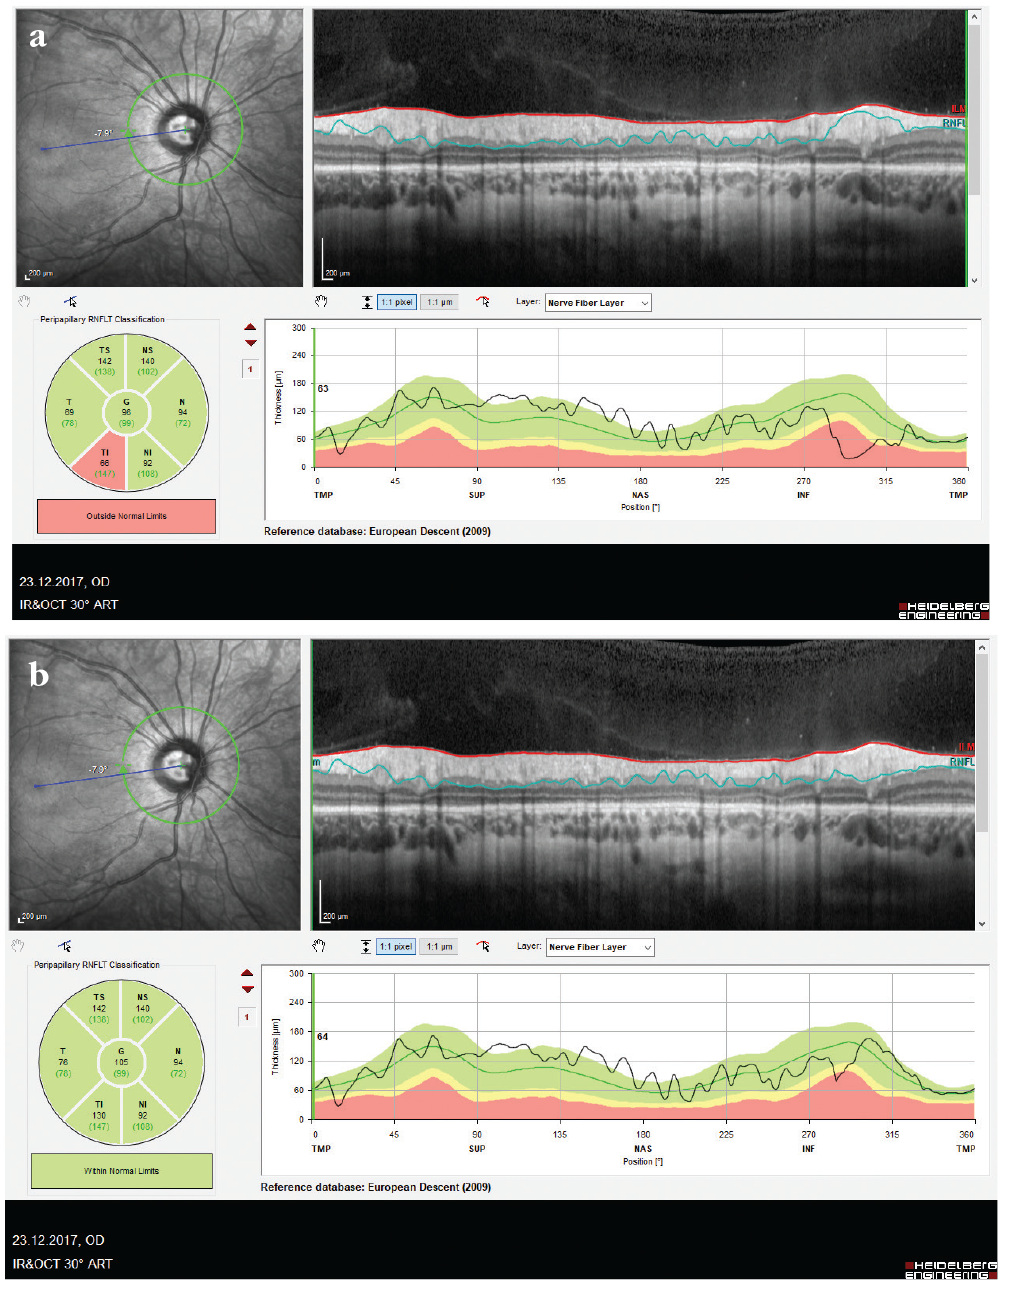
RNFL: Retinal nerve fiber layer, OCT: Optical coherence tomography
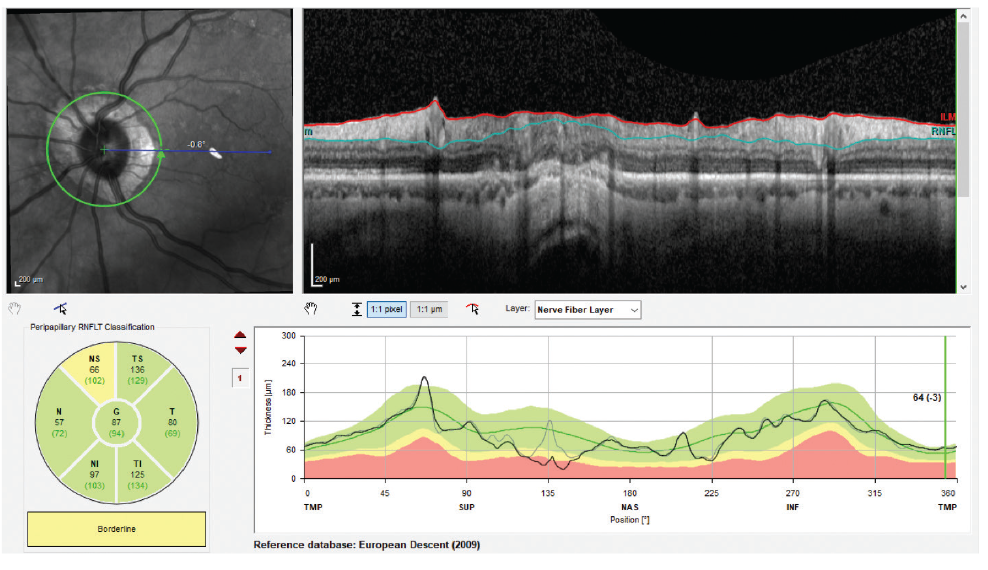
RNFL: Retinal nerve fiber layer, OCT: Optical coherence tomography
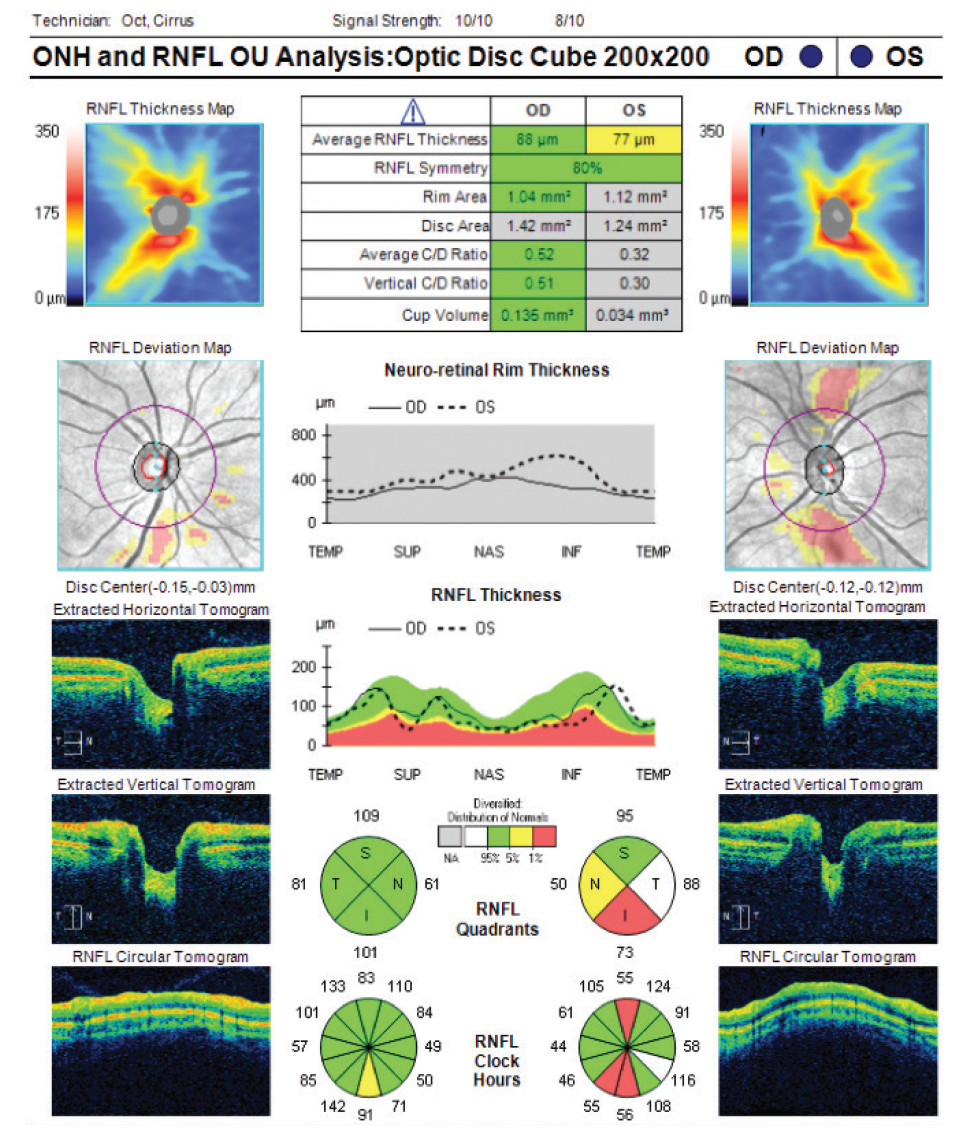
RNFL: Retinal nerve fiber layer, OCT: Optical coherence tomography
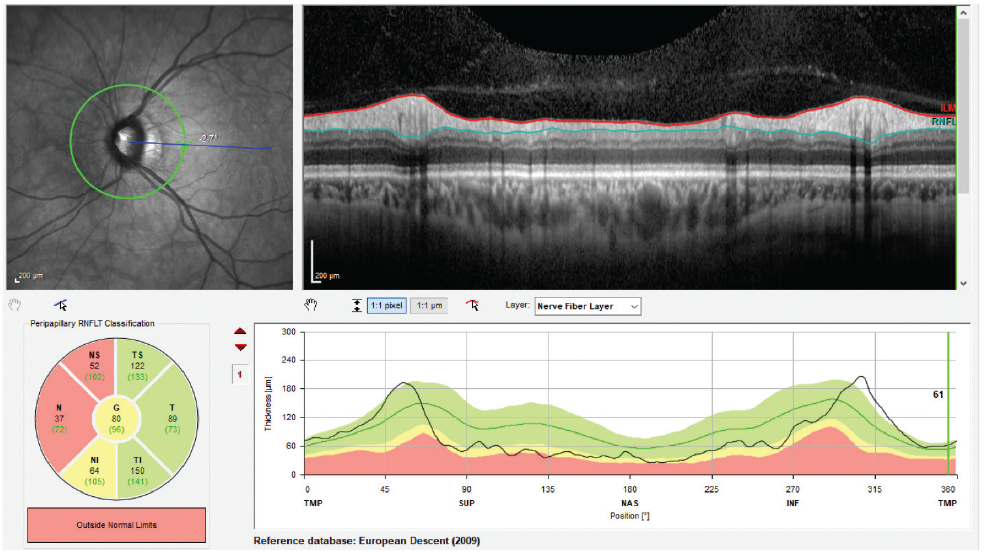
RNFL: Retinal nerve fiber layer, OCT: Optical coherence tomography
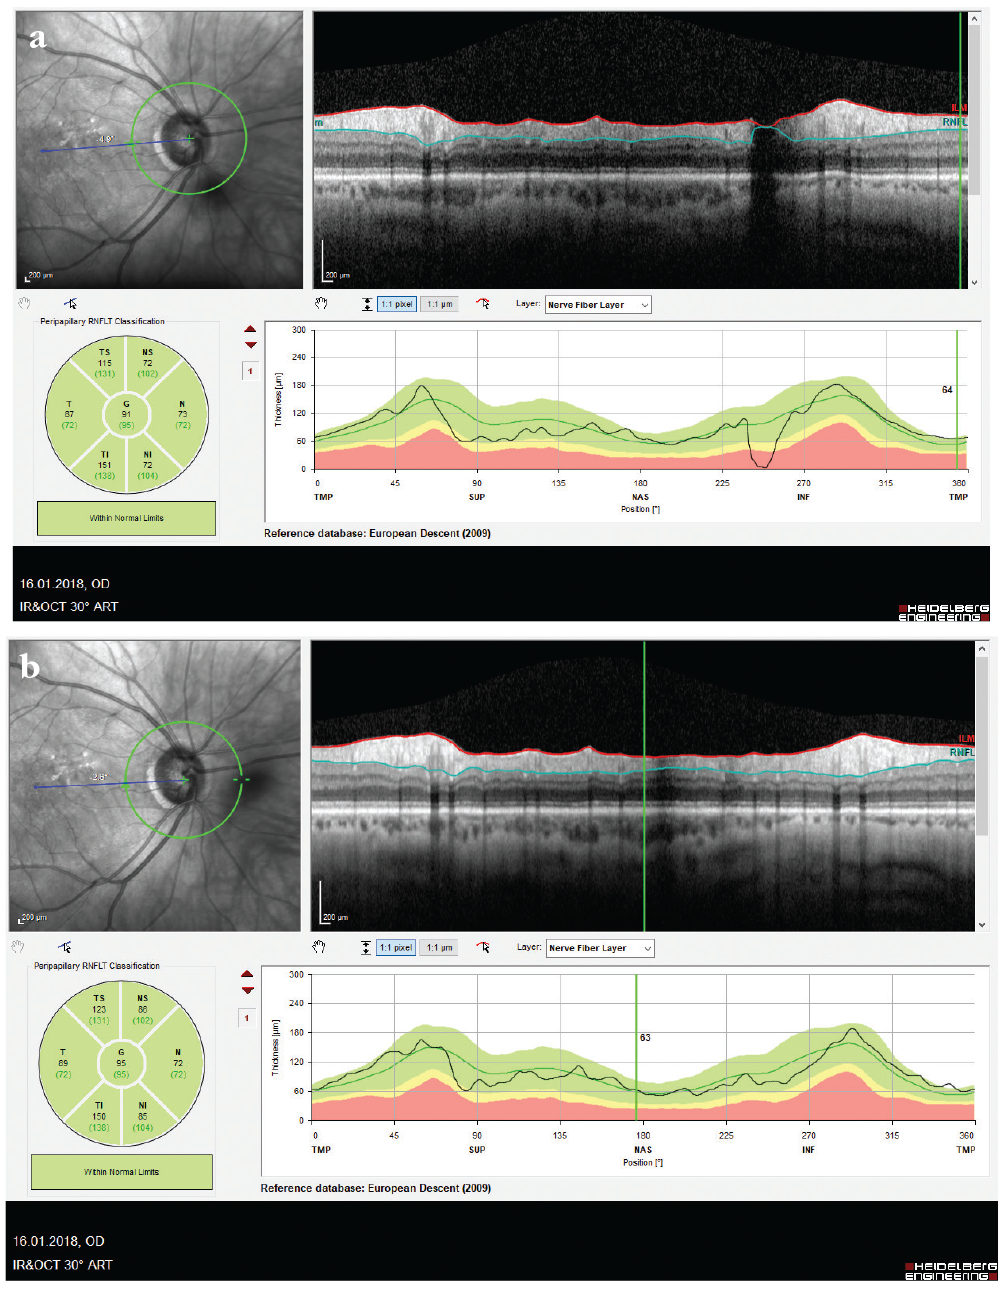
RNFL: Retinal nerve fiber layer, OCT: Optical coherence tomography
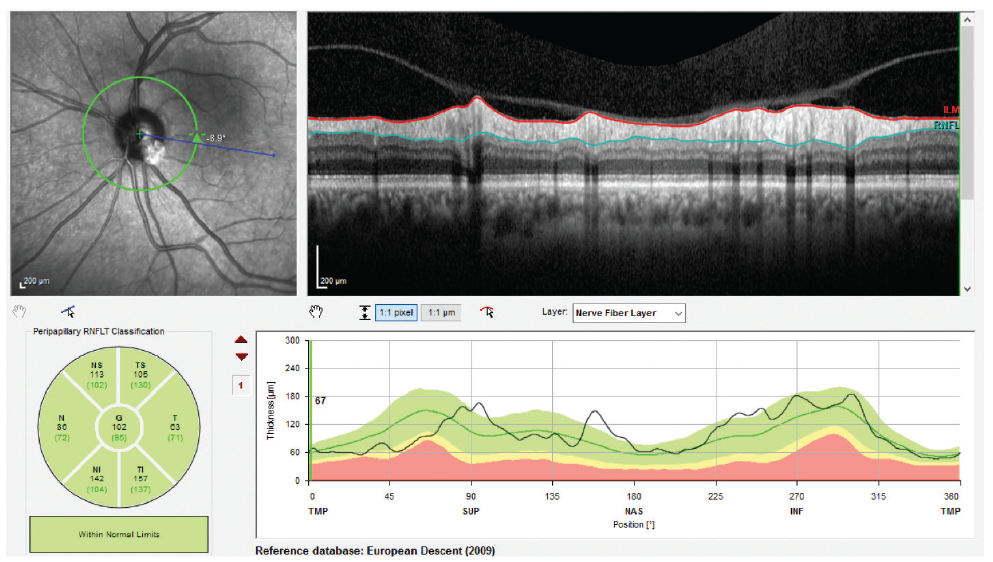
RNFL: Retinal nerve fiber layer, OCT: Optical coherence tomography
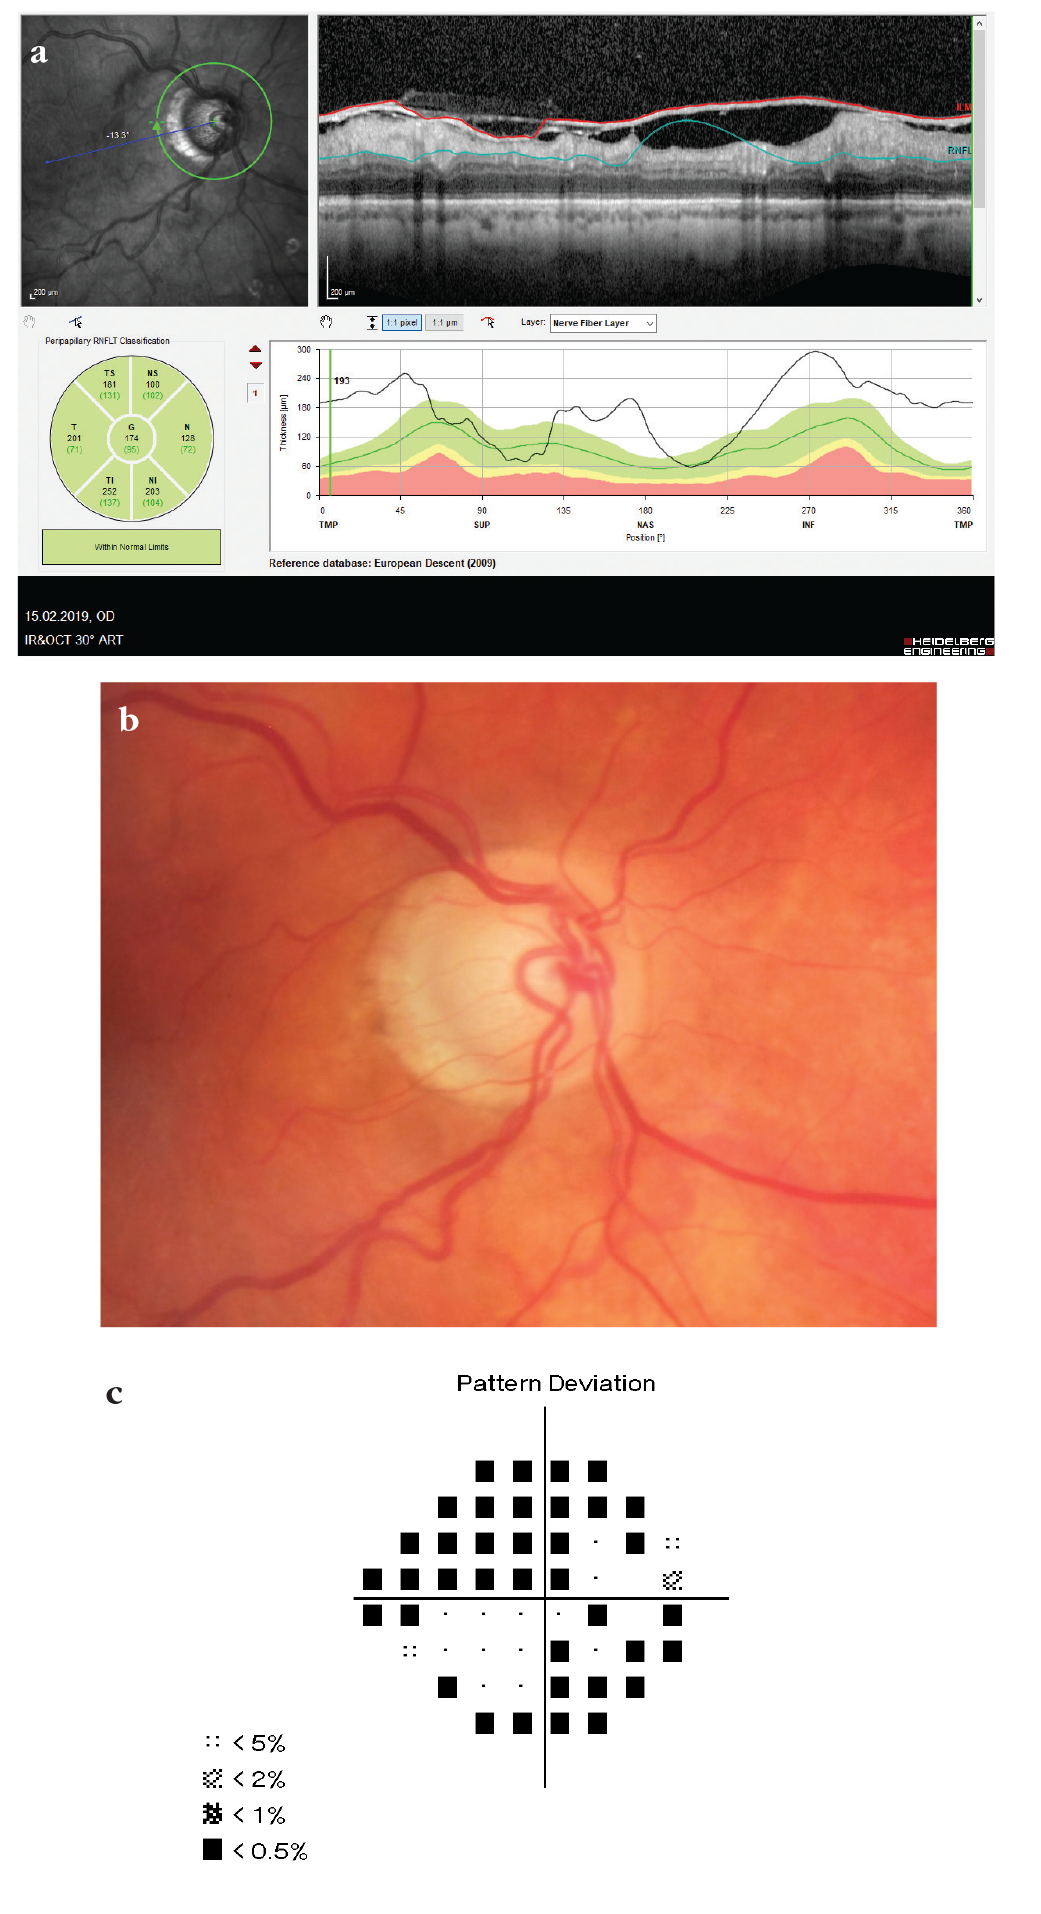
RNFL: Retinal nerve fiber layer, OCT: Optical coherence tomography
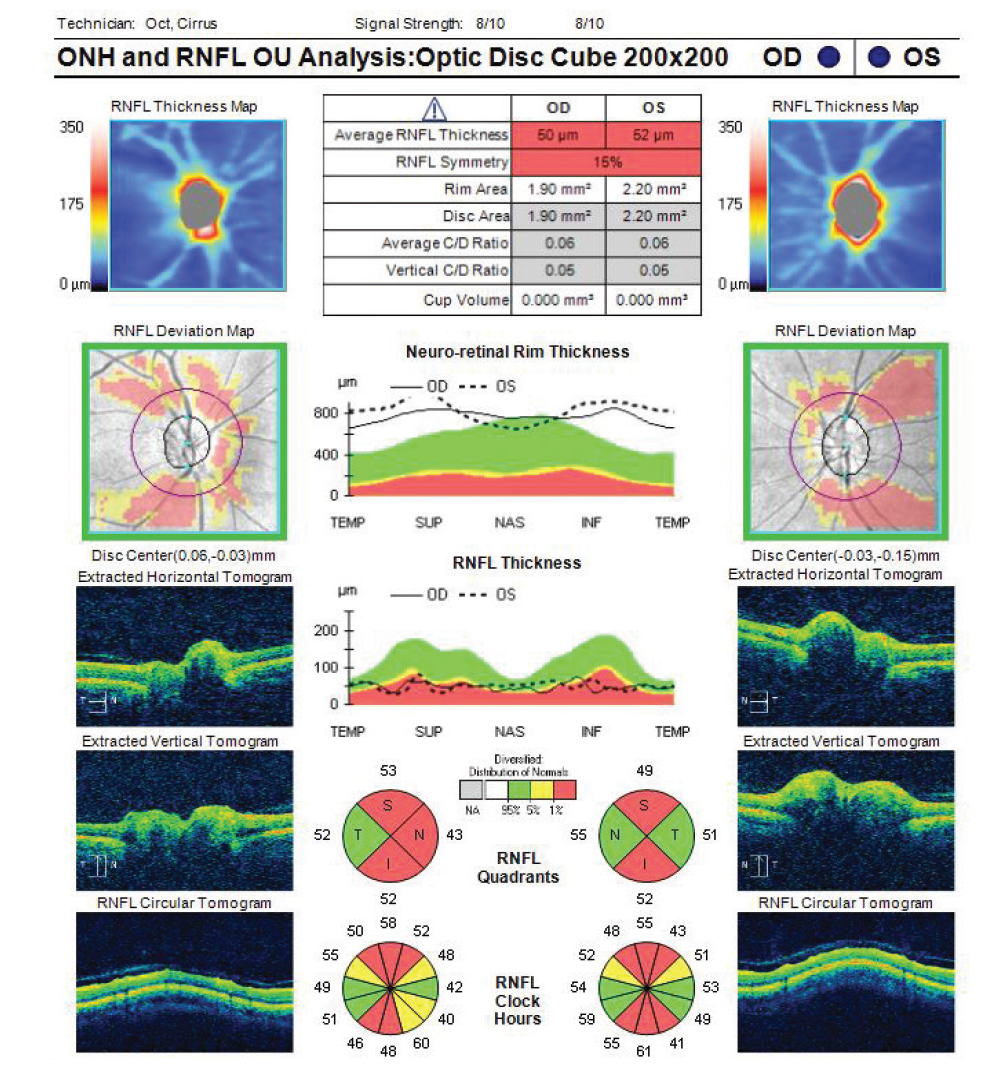
RNFL: Retinal nerve fiber layer, OCT: Optical coherence tomography
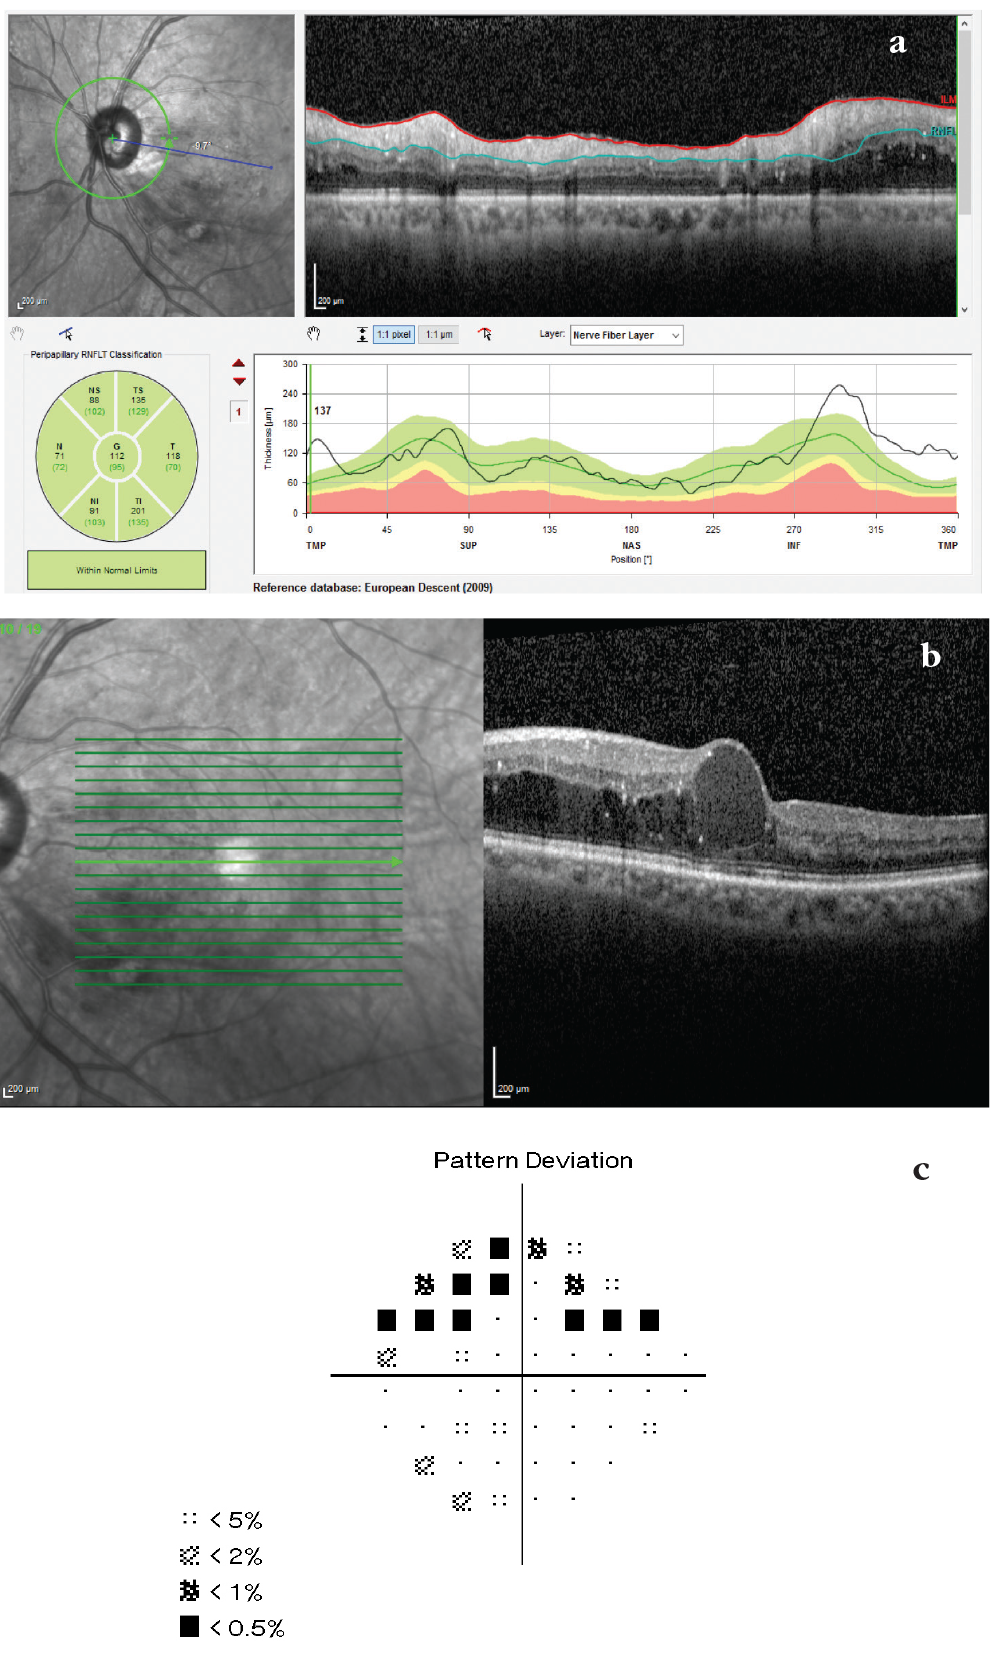
RNFL: Retinal nerve fiber layer, OCT: Optical coherence tomography
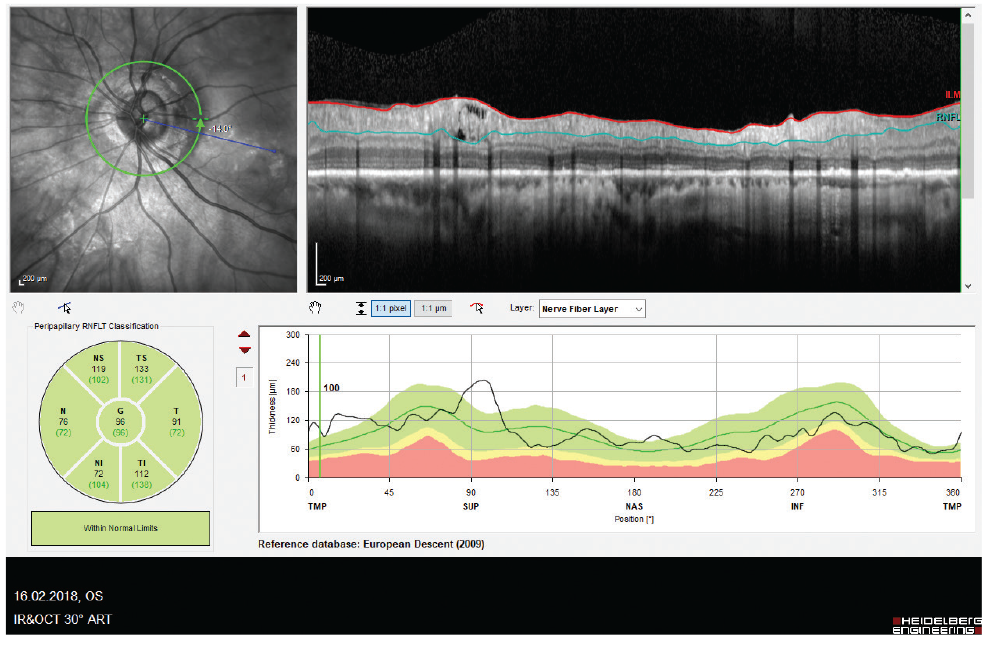
RNFL: Retinal nerve fiber layer, OCT: Optical coherence tomography
References
Stein JD, Talwar N, Laverne AM, Nan B, Lichter PR. Trends in use of ancillary glaucoma tests for patients with open-angle glaucoma from 2001 to 2009. Ophthalmology. 2012;119:748-758.
Gabriele ML, Wollstein G, Ishikawa H, Kagemann L, Xu J, Folio LS, Schuman JS. Optical coherence tomography: history, current status, and laboratory work. Invest Ophthalmol Vis Sci. 2011;52:2425-2436.
Dong ZM, Wollstein G, Schuman JS. Clinical utility of optical coherence tomography in glaucoma. Invest Ophthalmol Vis Sci. 2016;57:556-567.
Güngör SG, Akman A. Are all retinal nerve fiber layer defects on optic coherence tomography glaucomatous? Turk J Ophthalmol. 2017;47:267-273.
Asrani S, Essaid L, Alder BD, Santiago-Turla C. Artifacts in spectral-domain optical coher-ence tomography measurements in glaucoma. JAMA Ophthalmol. 2014;132:396-402.
Asrani S. Pitfalls in optical coherence tomography imaging. Glaucoma Today. 2016;(May/June):39-43.
Lee SY, Kwon HJ, Bae HW, Seo SJ, Lee YH, Hong S, Seong GJ, Kim CY. Frequency, type and cause of artifacts in swept-source and cirrus HD optical coherence tomography in cases of glaucoma and suspected glaucoma. Curr Eye Res. 2016;41:957-964.
Liu Y, Simavli H, Que CJ, Rizzo JL, Tsikata E, Maurer R, Chen TC. Patient characteristics associated with artifacts in spectralis optical coherence tomography imaging of the retinal nerve fiber layer in glaucoma. Am J Ophthalmol. 2015;159:565-576.
Kostanyan T, Sung KR, Schuman JS, Ling Y, Lucy KA, Bilonick RA, Ishikawa H, Kagemann L, Lee JY, Wollstein G. Glaucoma Structural and Functional Progression in American and Korean Cohorts. Ophthalmology. 2016;123:783-788.
Tastan S, Iyigun E, Bayer A, Acikel C. Anxiety, depression, and quality of life in Turkish patients with glaucoma. Psychol Rep. 2010;106:343-357.
Chong GT, Lee RK. Glaucoma versus red disease: imaging and glaucoma diagnosis. Curr Opin Ophthalmol. 2012;23:79-88.
Sayed MS, Margolis M, Lee RK. Green disease in optical coherence tomography diagnosis of glaucoma. Curr Opin Ophthalmol. 2017;28:139-153.
Rao HL, Addepalli UK, Yadav RK, Senthil S, Choudhari NS, Garudadri CS. Effect of scan quality on diagnostic accuracy of spectral-domain optical coherence tomography in glaucoma. Am J Ophthalmol. 2014;157:719-727.
Huang J, Liu X, Wu Z, Sadda S. Image quality affects macular and retinal nerve fiber layer thickness measurements on fourier-domain optical coherence tomography. Ophthalmic Surg Lasers Imaging. 2011;42:216-221.
Russell DJ, Fallah S, Loer CJ, Riffenburgh RH. A comprehensive model for correcting RNFL readings of varying signal strengths in cirrus optical coherence tomography. Invest Ophthalmol Vis Sci. 2014;55:7297-7302.
Colen TP, Lemij HG. Prevalence of split nerve fiber layer bundles in healthy eyes imaged with scanning laser polarimetry. Ophthalmology. 2001;108:151-156.
Kaliner E, Cohen MJ, Miron H, Kogan M, Blumenthal EZ. Retinal nerve fiber layer split bundles are true anatomic variants. Ophthalmology. 2007;114:2259-2264.
Hong SW, Ahn MD, Kang SH, Im SK. Analysis of peripapillary retinal nerve fiber distribution in normal young adults. Invest Ophthalmol Vis Sci. 2010;51:3515-3523.
Hood DC, Salant JA, Arthur SN, Ritch R, Liebmann JM. The location of the inferior and superior temporal blood vessels and interindividual variability of the retinal nerve fiber layer thickness. J Glaucoma. 2010;19:158-166.
Bayer A. Interpretation of imaging data from Spectralis OCT. Akman A, Bayer A, Nouri-Mahdavi K. Optical Coherence Tomography in Glaucoma (1st ed). Cham; Switzerland; Springer Nature; 2018:6;55-76.
Savino PJ, Glaser JS, Rosenberg MA. A clinical analysis of pseudopapilledema. II. Visual field defects. Arch Ophthalmol. 1979;97:71-75.
Roh S, Noecker RJ, Schuman JS, Hedges TR, Weiter JJ, Mattox C. Effect of optic nerve head drusen on nerve fiber layer thickness. Ophthalmology. 1998;105:878-885.
Moore DB, Jaffe GJ, Asrani S. Retinal nerve fiber layer thickness measurements: uveitis, a major confounding factor. Ophthalmology. 2015;122:511-517.
Hwang YH, Kim YY, Kim HK, Sohn YH. Effect of peripapillary retinoschisis on retinal nerve fibre layer thickness measurement in glaucomatous eyes. Br J Ophthalmol. 2014;98:669-674.
Bayraktar S, Cebeci Z, Kabaalioglu M, Ciloglu S, Kir N, Izgi B. Peripapillary retinoschisis in glaucoma patients. J Ophthalmol. 2016;2016:1612720.