
Öz
Fundus otofloresans (FOF), uzun yıllardır bilinen bir görüntüleme yöntemi olmasına karşın, son yıllarda gelişen teknolojiye bağlı olarak yeni görüntüleme cihazlarının kullanıma girmesi, oftalmoloji klinik pratiğinde retina hastalıklarının ayırıcı tanısı ve hastalık takibinde sıkça kullanılmasını sağlamıştır. Retinada bulunan lipofusin (LF) ve diğer floroforların yoğunluğu, FOF görüntüleri için belirleyici rol oynamaktadır. Kuru tip yaşa bağlı maküla dejeneresansında (YBMD), retina pigment epitel hücrelerinde artan LF, hiperotofloresansa, coğrafik atrofide retina pigment epitel hücresi kaybına bağlı azalan LF ise hipootofloresansa neden olmaktadır. Son yıllarda, YBMD’sinde FOF görüntülerinin, prognoz ile ilgili bilgi verdiği çalışmalar ile gösterilmiştir. Derlemede, FOF görüntülemenin, kuru tip YBMD’sinde kullanım yeri ve önemini aktarmak amaçlanmıştır.
Anahtar Kelimeler: Yaşa bağlı maküla dejeneresansı, fundus otofloresans, coğrafik atrofi, lipofusin, retina
Giriş
Fundus otofloresans (FOF), belirli bir dalga boyundaki ışıkla uyarılan floroforların yaydığı ışığın, bariyer filtrelerden geçirilerek ölçülmesi prensibine dayanan, noninvaziv bir görüntüleme yöntemidir.
Fundusta otofloresans varlığı, ilk kez fundus fluorescein anjiyografi (FA) çekilmeden hemen önce alınan görüntülerde fark edilmiş ve psödofloresans olarak adlandırılmıştır.1 Konfokal lazer tarayıcı oftalmoskop [confocal laser scanning ophthalmoscopy (cSLO)] sistemlerinin kullanıma girmesi ile FOF görüntülerinin kalitesi artmış, FOF görüntüleme yöntemi retina hastalıklarının tanı ve takibinde yerini almıştır.
FOF görüntülerini, retinadaki florofor yoğunluğu belirlemektedir. Retina pigment epitelinde (RPE) bulunan lipofusin (LF), retinadaki en önemli floroforlardandır. LF miktarının artması hiper, azalması hipootofloresans görünüme yol açmaktadır.
Fundus otofloresans görüntüleme yöntemi, retina hastalıklarının patofizyolojik mekanizmalarının açıklanmasında, progresyon riskini değerlendirmede ve uygulanan güncel tedavi sonuçlarının takibinde faydalı bir görüntüleme yöntemi olarak yerini almıştır.
Derlememizin amacı, FOF görüntüleme yöntemi ile ilgili temel bilgilerin verilmesinin yanında, kuru tip yaşa bağlı maküla dejeneresansında (YBMD) kullanımının önemini aktarmaktır.
Retina Pigment Epiteli ve Lipofusin
Poligonal tek katlı hücrelerden oluşan RPE, koroidi nörosensoryal retinadan ayırmaktadır. Retinanın normal işlev görebilmesi için kritik bir role sahip olan RPE, fotoreseptörlerin dış segmentlerinin fagositozu ve lizozomal yıkımından sorumludur.2 Yaşam boyunca, her RPE hücresi üç milyar dış segmenti fagosite etmektedir.2
Yaşlanmayla, fotoreseptör dış segmentlerinin yetersiz yıkımı, RPE’de LF birikimine sebep olmaktadır. LF, 470 nm dalga boyundaki mavi ışığı absorbe eden ve 600-610 nm dalga boyunda sarı-yeşil ışık yayan, maküler florofordur.3 Heterojen bir molekül olan LF, vitamin A ve görme siklusunun yan ürünlerinden oluşmaktadır. Yaşlanma ile RPE lizozomlarında, LF birikimi artmakta, yetmiş yaş üstünde, RPE sitoplasmasının dörtte biri LF ve melanolipofusinden oluşmaktadır.4 Bununla birlikte, fazla LF birikimi patolojiktir ve RPE’de apopitozise sebep olmaktadır. LF miktarının, YBMD gibi retinanın dejeneratif hastalıklarında, Best ve Stargardt hastalığı gibi makula distrofilerinde arttığı bilinmektedir.5
LF, birçok farklı molekülden oluşmasına rağmen, en önemlisi N-retinyl-N-retinylidene ethanolamine’dir (A2E). “N-retinyl-N-retinylidene ethanolamine”, fotoreseptör dış segmentinde, iki vitamin A aldehit (all-trans retinal) molekülünün bir “phosphatidyl ethanolamine” ile birleşmesi sonucu oluşmaktadır.6 Lizozomal enzimler tarafından tanınamadığı ve yıkımı tamamlanamadığı için A2E’nin, lizozomların içinde biriktiği düşünülmektedir. LF fazla birikimini açıklayan bir başka teori ise; reaktif olan A2E molekülünün lizozomal enzimlerin metabolizmasını engelleyerek, proteolitik enzimleri inaktive etmesidir.7 RPE hücrelerinin, lizozomal kompartmanında biriken bu madde yaşlanma süreci için karakteristiktir.
LF’nin başka bir komponenti olan “all-trans retinal” bir toksik aldehittir. Fotoreseptörlerin dış segmentinde, ışığa maruziyet sonucu üretilmektedir. Fotoreseptörlerde “cis-trans isomerase” fonksiyonu olmadığından “all-trans retinal”, “11-cis-retinal’e dönüştürülemez”.8 “All-trans, retinal” fotoreseptörde birikirerek bisretinoidleri oluşturur. Bisretinoidlerin oksidasyonu ile LF üretilir.9 Işık ile uyarılan fotoreseptör kaybı ile LF birikiminin azaldığı bilinmektedir.10
LF’nin, A2E ve all-trans retinal dışında başka komponentleri de bulunmaktadır.11 Bu moleküller; A2E prekürsörleri, okside A2E molekülü parçaları, protein ve lipidlerin peroksidasyon ürünleridir.11
LF’yi meydana getiren retinoid floroforlar, uzun konjuge bağlardan oluşmaktadır. Retinoid floroforların bu yapıları, ışığı absorbe edip ardından floresans yaymalarını sağlamaktadır. Otofloresans özellikleri, RPE hücrelerindeki LF granüllerinin floresans mikroskop ile fark edilebilmesini mümkün kılmaktadır.12
Fundus Otofloresans ve Çalışma Prensibi
Floresan mikroskopide, in vitro incelemelerde, LF’yi tespit edebilmek için ultraviyole ışığı kullanılmaktadır. LF eksitasyonu, 300 nm ile 600 nm arası gibi geniş spektrumdaki dalga boyları ile gerçekleşebilmektedir. Emisyon spektrumu da geniş (480-800 nm) olmasına karşın, 600 ile 640 nm arasında maksimumdur.13
Otofloresans tanımı, fundus FA kullanımı ile ortaya çıkmış, otofloresansın kantitatif değerlendirilmesi ise, 1989 yılında florofotometri kullanımı ile Kitagawa ve ark. tarafından yapılmıştır.14,15
FOF görüntülerinin net olmasını engelleyen önemli bir faktör retina önünde yer alan (lens gibi) anatomik yapıların otofloresans vermesidir. Son yıllarda, kamera sistemlerindeki gelişmeler ve yeni sofistike görüntüleme yöntemleri ile daha net FOF görüntülerinin alınması mümkün olabilmektedir.
Retinanın Geniş Açılı Görüntülenmesi: Geniş Açılı Fundus Kameraları
Retinanın görüntülenmesini sağlayan fundus kameraları ilk olarak Carl Zeiss firması tarafından 1926’da kullanıma sunulmuştur.16 İlk üretilen cihaz 20 derecelik fundus alanını görüntülemeyi sağlarken, gelişen teknoloji ile görüntülenen alan genişlemiştir. Günümüzde klinik pratikte kullanımda olan birçok cihaz 50 derecelik alanın görüntülenmesini sağlamaktadır. Elli dereceden fazla alanı görüntüleyen fundus kamaraları; “geniş-açılı” olarak nitelendirilmektedir. Son zamanlarda, “ultra-wide-field” olarak adlandırılan ve daha geniş retina alanlarını görüntüleyen cihazlar gündeme gelmiştir.17 Bu cihazlardan biri olan Heildelberg Spectralis (Heidelberg Engineering, Inc., Heidelberg, Almanya), 102 derecelik retina alanını görüntüleyebilmektedir. Bunun yanında FOF, FA, indosiyanin yeşili anjiyografisi tetkiklerinin aynı cihazla yapılarak, ekvatora kadar olan alandaki koroid ve retina yapılarının değerlendirilmesini sağlamaktadır.
Ticari olarak 2000 yılında ulaşılabilir olan diğer bir geniş açı görüntüleme sistemi Optos’tur (Optos PLC, Dunfermline, UK). Optos kamera sistemi (Optos PLC, Dunfermline, UK), cSLO sistemini içermekte ve pupilla dilatasyonu veya bir kontakt lens olmadan, tek görüntüde retina periferinin incelenmesine fırsat vermektedir. Optos sistemi içerisinde, perifer retinanın görüntülenmesinde elipsoid bir aynadan faydalanılmaktadır.18 Bu tasarım, geniş açılı görüntü elde edilmesini sağlar. Hasta uyumu iyi ve pupilla iyi dilate ise, ora serrataya kadar görüntü alınabilmektedir.
Sağladığı kolaylıkların yanında, Optos sisteminin bazı dezavantajları bulunmaktadır. Bunlar; tüm perifer retinanın görüntülenememesi, görüntünün gerçek görüntüden farklı renklerde olması, standart fundus kameralar ve Heidelberg Spectralis gibi yüksek rezolüsyondaki konfokal tarayıcı lazer sistemleri ile karşılaştırıldığında arka kutup rezolüsyonunun az olmasıdır.
Optos ve Spectralis sistemlerinin her ikisi de, simültane FA ve indosiyanin yeşili anjiyografisi görüntülerini sağlayabilmektedir. Spectralis “ultra-wide-field” lens sisteminde FOF görüntüleri net olmamasına karşın, 30 ve 55 derece FOF görüntülerinin çözünürlüğü yüksek olmaktadır.
Konfokal Tarayıcı Lazer Oftalmoskopi (Confocal Scanning Laser Ophthalmoscopy)
cSLO, Webb ve ark. tarafından geliştirilmiş, von Rückmann ve ark.19 tarafından klinik kullanıma kazandırılmıştır. Bu sistemde, noktasal bir kaynaktan projekte olan düşük güçlü lazer ışını ile retina taranarak, retinal otofloresansın ortaya çıkması sağlanmaktadır. Yansıyan ışık, cihazın içerdiği lensin fokal noktasında yer alan ufak bir açıklıktan (confocal pinhole) geçerek saçılma engellenmekte, böylece net fundus görüntülerinin oluşması sağlanmaktadır. cSLO ile birkaç görüntü alınmakta, kesitlerin ortalaması oluşturulmakta, piksel değerleri normalize edildikten sonra net görüntüler oluşmaktadır.20 Görüntülenen alan, 30 derece olmakla beraber, sistemde yapılan lens değişikliği ile daha geniş alan görüntülenebilmektedir.20 cSLO ile, retina önünde yer alan ve otofloresans veren yapıların, retinal otofloresansı bloke etmesinin önüne geçilmiştir.
Günümüzde, FOF görüntüleri sağlayan birçok cSLO bulunmaktadır. Bunlardan birkaçı; Zeiss SM 30 4024 (ZcSLO, Zeiss, Oberkochen, Almanya), Rodenstock cSLO (RcSLO; Rodenstock, Weco, Düsseldorf, Almanya), Heidelberg Retina Anjiyografisi Sistemi (HRA classic, HRA 2, Spectralis®, Heidelberg Engineering, Dossenheim, Almanya), F-10 (Nidek, Aichi, Japonya), ve Optomap® Panoramic 200 Tx’tir (Optomap; Optos, İskoçya).
HRA 2’nin eksitasyon oluşturan ışığı; dalga boyu 488 nm olan mavi solid-state diod lazer ışığı olup, 500 nm bariyer filtresi ile FOF görüntülerini oluşturmaktadır.21 Spectralis® (Spectralis SD-OCT, Heidelberg Engineering GMbH, Heidelberg, Almanya) cihazı ise, HRA 2’den farklı olarak cSLO ile optik koherens tomografi (OKT) görüntülerini senkronize olarak bir araya getirmektedir.
Retinada bulunan floroforların, yaydığı floresansın dalga boyu, geniş bir spektrum içinde yer almaktadır. Bu nedenle eksitasyon dalga boyuna bağlı olarak, otofloresansı sağlayan floroforlar değişmekte ve FOF görüntüsü farklı olabilmektedir. En sık kullanılan eksitasyon ışığı mavi ışıktır (488 nm) ve mavi otofloresans (kısa dalga boylu otofloresans, blue-AF, short wave-AF) olarak adlandırılır. Mavi otofloresansta, 488 nm (mavi ışık) dalga boyunda ışık ile eksitasyon yapılmakta, açığa çıkan dalga boyu, 500-800 nm arasında olmakta ve 630 nm dalga boyunda pik yapmaktadır. Bu dalga boyunda pik izlenmesinin nedeni; LF’nin 630 nm’de ışık yaymasıdır.22
Kızılötesi otofloresansta [near-infrared autofluorescense; (NIR-AF] 787 nm dalga boyunda eksitasyon ışığı kullanılmakta, 800 nm dalga boyunda emisyon filtresi kullanılmaktadır. NIR-AF için başlıca florofor melanindir. Koroid ve RPE’de melanin yoğunluğunun fazla olmasına bağlı olarak flöresans daha belirgindir.23 NIR-AF görüntülemede, RPE atrofisi, azalmış sinyal olarak görülmekle beraber koroidde bulunan melaninden dolayı, düşük düzeyde sinyal alınabilmektedir.
Son zamanlarda, yeşil ışık (504 nm ve 532 nm) kullanıma girmiş ve geniş açılı retina görüntüleme sistemlerine adapte edilmiştir. Yeşil ışık mavi ışığa göre, maküla pigmentleri tarafından daha az absorbe edildiği için, maküladaki LF sinyalinin daha iyi değerlendirilmesini sağlayabilmektedir.24 Bu nedenle, yeşil otofloresans foveadaki değişimleri daha net ortaya koyabilmektedir. Yeşil ışıkta kullanılan eksitasyon ışığının daha düşük enerjiye sahip olması, görüntü alınması sırasında hastanın daha konforlu olmasını da sağlamaktadır.25
Fundus Otofloresans ile Sağlıklı Fundusun Görünümü
Sağlıklı fundusta görülen diffüz otofloresans, foveadan itibaren 5-15 derece arasında en yoğundur. Optik sinir; LF içermemesi, retina damarları; kanın otofloresansı bloke etmesi nedeniyle hipootofloresans görülmektedir.
Ksantofiller (lutein ve zaaksantin), foveada fotoreseptör ve RPE hücrelerini, mavi ışığı filtre ederek, serbest radikalleri temizleyerek ve subfoveal RPE hücrelerinin doğal otofloresansını maskeleyerek korumaktadır.26 Kısa dalga boylu otofloresansta kullanılan mavi ışık, ksantofiller tarafından absorbe edilmektedir.27 Foveada, bu pigmentler yoğun olduğu için, bu bölge hipootofloresans görülmektedir. Buna ek olarak, foveadaki melanin yoğunluğu da, ışığın absorbe edilmesine sebep olur.28
Melanin yoğunluğu nedeni ile fovea, hiperotofloresan olarak izlenmektedir. Maküladaki RPE hücreleri daha silindirik şekildedir ve periferden farklı olarak daha az LF, daha fazla melanin içermektedir.28 Kısa dalga boylu otofloresans görüntülemeye benzer şekilde, NIR-AF’te de optik disk ve retina damarları, hipootofloresans görülmektedir.
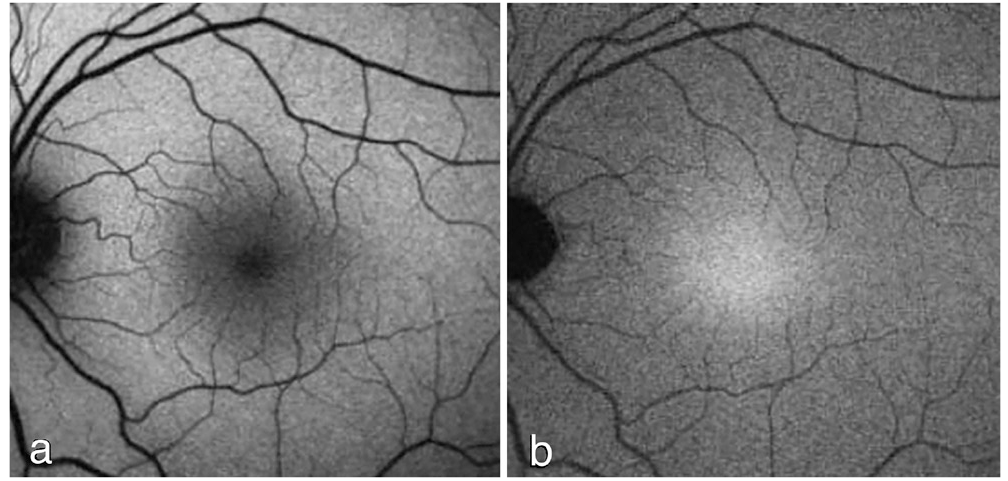
Kızılötesi otofloresansta, kullanılan ışık uzun dalga boylu olduğu için ortam opasiteleri tarafından daha az absorbe edilmektedir. Coğrafik atrofi lezyonları, atrofik olmayan alanlardan daha parlak görünmekte ve foveadaki lezyon sınırları daha net seçilebilmektedir. Kısa dalga boylu otofloresans görüntülemede kontrast daha azdır. ’de normal fundusun FOF görüntüleri görülmektedir.
Fundus Otofloresans Görüntülerinin Klinikte Kullanımı
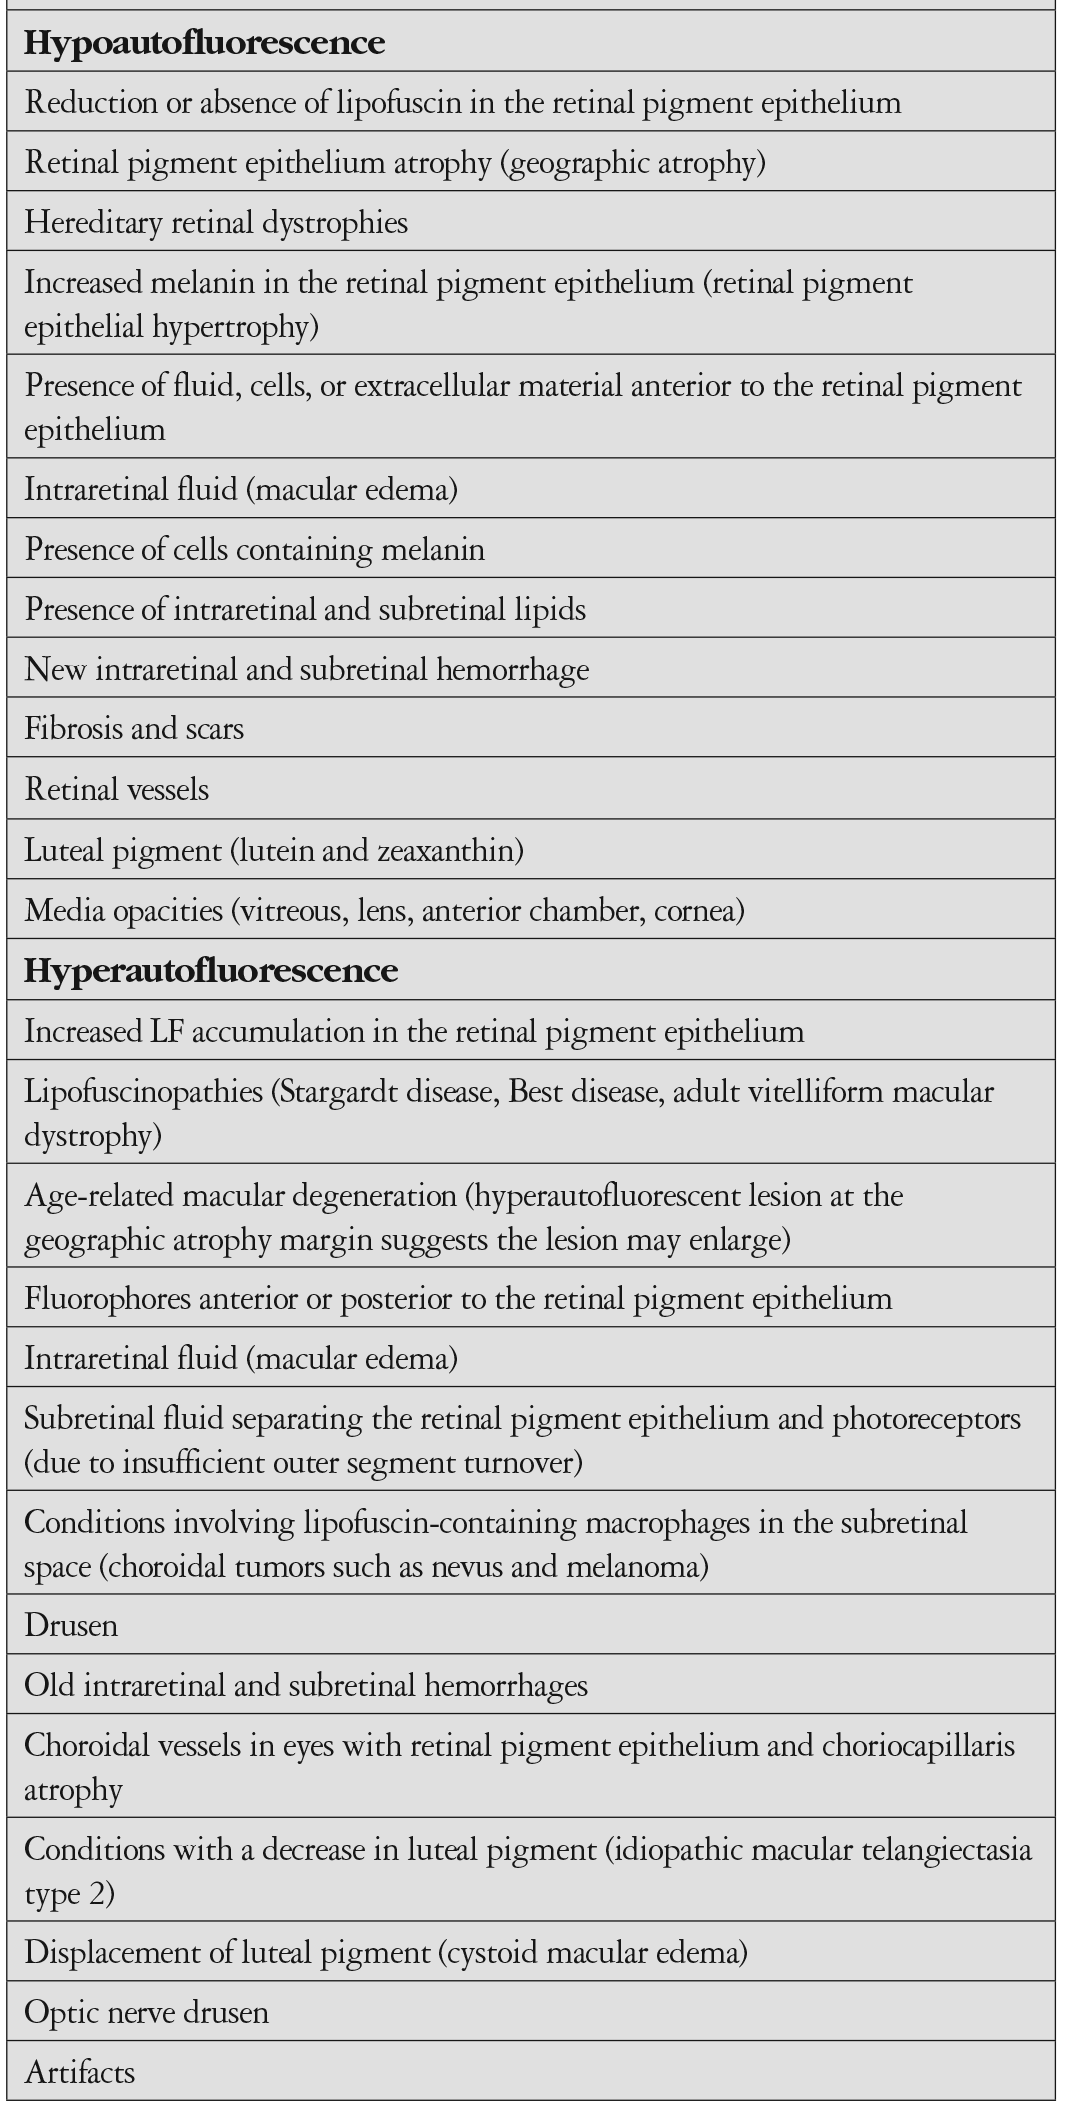
Fundus otofloresans görüntüleri incelenerek, RPE ile ilgili bilgi edinilebilmektedir. Hipootofloresans, RPE hücrelerinde azalma ve/veya düşük LF konsantrasyonu olduğunu belirtir. RPE atrofisi, hipootofloresans olarak görülmektedir.29 Bunun dışında fibrozis, intraretinal sıvı, pigment ve kan mevcudiyeti de otofloresansı azaltan faktörlerdir. Hiper ve hipootofloresansın görüldüğü durumlar ’de gösterilmiştir.
LF birikiminin görüldüğü; Stargardt, Best hastalığı ve adult vitelliform maküla distrofisi gibi durumlarda, artmış otofloresans görülmektedir. Drusen varlığında ve maküla ödeminde de hiperotofloresans izlenmektedir.26 Coğrafik atrofi olgularında, atrofi alanını çevreleyen hiperotofloresans alanları izlenebilmektedir. YBMD olan olgularda fundus periferinde de otofloresans değişimleri olduğu gösterilmiştir.30
Fundus Otofloresansın Kuru Tip Yaşa Bağlı Maküla Dejeneresansında Kullanımı
Beckman sınıflamasına göre YBMD, erken, orta ve geç dönem olarak sınıflandırılmıştır.31 Bu sınıflamada küçük drusen varlığı (drupelet, <63 µm) normal yaşlanmaya ait değişim olarak kabul edilmektedir. Orta boy drusen (≥63 ile <125 µm arası) varlığı erken YBMD, büyük drusen (≥125 µm) varlığı veya pigment değişimleri ile birlikte orta boy drusen varlığı orta dönem YBMD olarak tanımlanmıştır.
Pigment Değişimlerinin Fundus Otofloresans ile Görüntülenmesi
YBMD’sinde izlenen hiperpigmentasyon, FOF görüntülerinde tipik olarak; fokal, lineer ve/veya dantel benzeri hiperotofloresansa neden olabilmektedir.32 FOF değişimlerinin, melanolipofusin varlığına bağlı olduğu düşünülmektedir.32 Melanolipofusin birikimi, uniform olmayabilir. Melanin içeriğinin fazla veya az olmasına bağlı olarak, otofloresans görünümü farklılık gösterebilmektedir.
Hipopigmente alanlar, RPE dejenerasyonuna veya azalmış LF içeriğine bağlı olarak hipootofloresans göstermektedir.33
Erken Evre ve Orta Evre YBMD’de Fundus Otofloresans Görüntüleme
YBMD’sinin erken bulgusu olan drusenin görüntülenmesi, geç evreye ilerleme konusunda ipucu verebildiği için, önem taşımaktadır. Drusenin, yumuşak, refraktil, bazal laminar ve kutiküler drusen gibi alt tipleri bulunmaktadır.34 Retina altı yerleşimli retiküler psödodrusen (RPD) ise drusenin başka bir alt tipidir. Drusenin ayrımı, renkli fundus fotoğrafı, fundus FA, NIR-reflektans, FOF ve OKT’yi kapsayan multimodal görüntüleme yöntemleri ile yapılabilmektedir.34
FOF görüntülemede, drusen farklı şekillerde görülebilmektedir.33 Hiperotofloresans görünüm, drusendeki veya drusenin üzerinde yer alan RPE içindeki LF’sine bağlı görülebilmektedir. Hipootofloresans görünümü, gerilemiş drusen veya dejenere RPE hücrelerinden kaynaklanır.
Küçük ve orta boy drusen, değişken FOF görüntüleri verebilmekte, bazen gözden kaçabilmektedir.33 Farklı otofloresans görünümleri, drusen içeriklerinin de farklı olabileceğini düşündürmektedir. Yumuşak drusen, FOF görüntülemede, dış kenarları hafifçe merkezden daha fazla hiperotofloresans alanlar olarak izlenmektedir. Kutiküler drusen, noktasal şekildedir ve hipootofloresans gösterir. Drusenoid pigment epitel dekolmanı, hiper ve hipootofloresans alanların oluşturduğu, yamalı patern göstermektedir.35
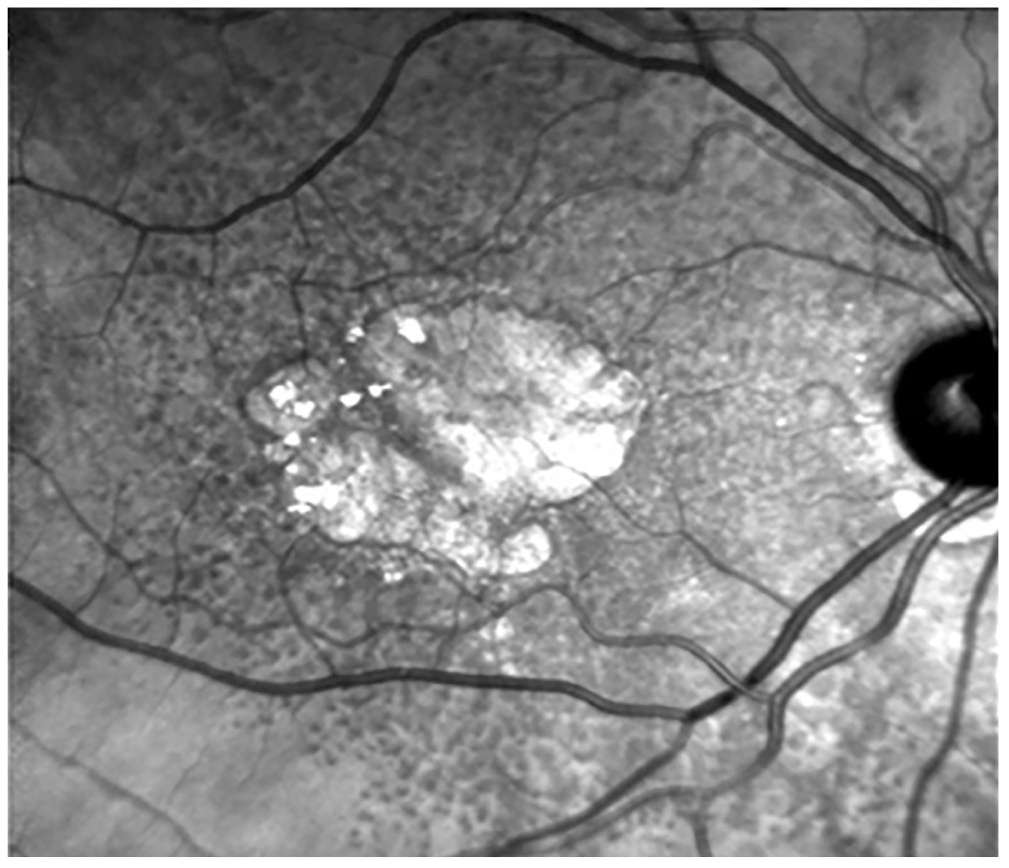
Subretinal yerleşimi ile diğer drusen tiplerinden farklılık gösteren RPD, geç evre YBMD’ye progresyonda, risk faktörü olarak düşünülmektedir. RPD varlığının gösterilmesinde, renkli fundus fotoğrafına göre, FOF görüntüleme yönteminin sensitivitesinin daha fazla olduğu bilinmektedir.36 Yapılan çalışmalarda, retiküler drusen varlığının, geç evre YBMD gelişimi için önemli bir risk faktörü olduğu gösterilmiştir.37,38 RPD, fundus muayenesinde küçük, sarı-beyaz, yuvarlak veya oval lezyonlar olarak izlenir. FOF görüntülemede, çok sayıda, küme şeklinde, küçük (50-400 µm çapında, genellikle <200 µm), düzenli dizilim gösteren, homojen, yuvarlak veya oval, düşük kontrast hipootofloresans gösteren alanlar olarak izlenmektedirler.33 Yerleşimi daha çok fovea üst bölümünde olmakta, prevalansı yaşla artmakta ve kadınlarda daha sık görülmektedir.33 Erken evre YBMD’de, RPD varlığına, FOF görüntülemede karakteristik görünümü nedeni ile “retiküler patern” adı verilmiştir.33 Retiküler drusenin, hipootofloresans görülme sebebi net olarak bilinmese de, RPE içindeki LF’sini bloke eden, subretinal deposit birikimine bağlı olduğu düşünülmektedir.39 ’de, cSLO ile görüntülenen RPD izlenmektedir.
RPD’nin, coğrafik atrofi olgularında sık görülmesi, hastalığa eşlik eden bir bulgu olduğunu düşündürmektedir. Fakat RPD’nin oluşum mekanizması ve hastalık progresyonuna etkisinin, hangi yol ile olduğu henüz net olarak bilinmemektedir.
Erken evre YBMD olgularındaki FOF değişimleri, uluslararası bir çalışma ile sınıflanmıştır. The International Fundus Autofluorescence Classification Group34, bu olgularda sekiz farklı otofloresans paterni tanımlamıştır. Bu paternler; normal, minimal değişiklik, fokal artış, yamalı, lineer, dantel benzeri, retiküler ve benekli olarak adlandırılmıştır. Bu çalışmaya göre, anormal otofloresans görülen alanlarda, RPE seviyesinde hasarın başladığı öngörülmüştür. Erken evre YBMD için belirlenen bu sınıflama, hastalığın prognozu ile ilgili ipucu verebilmektedir.
Orta evre YBMD’de en çok rastlanan bulgu, nokta şeklinde artmış otofloresans gösteren alanlardır (%87,9).40 Azalmış otofloresans gösteren noktasal alanlar (%26,7) ve çizgisel artmış otofloresans alanları (%19,8), daha az oranda da olsa izlenebilmektedir.40
Neovasküler dönüşüm için, FOF bulgularının, fikir verici olduğu bildirilmiştir.41 FOF kullanarak yapılan analizin diğer görüntüleme yöntemleri (renkli fundus fotoğrafı, fundus FA, indosiyanin yeşili anjiyografisi ve OKT) ile karşılaştırıldığında neovaskülarizasyona dönüşümü belirlemede en duyarlı metod olduğu bildirilmiştir.41 Batioglu ve ark.33, yamalı, lineer ve retiküler FOF paternlerin, koroidal neovasküler membrana dönüşme riskinin yüksek olduğunu, göstermişlerdir. Erken ve orta evre YBMD’de belirlenen FOF fenotipleri, hastalığın prognozu ile ilgili bilgi vermekte, hastayı bilgilendirmede ve takip aralıklarının belirlenmesinde faydalı olabilmektedir.
Fundus Otofloresansın Coğrafik Atrofide Kullanımı
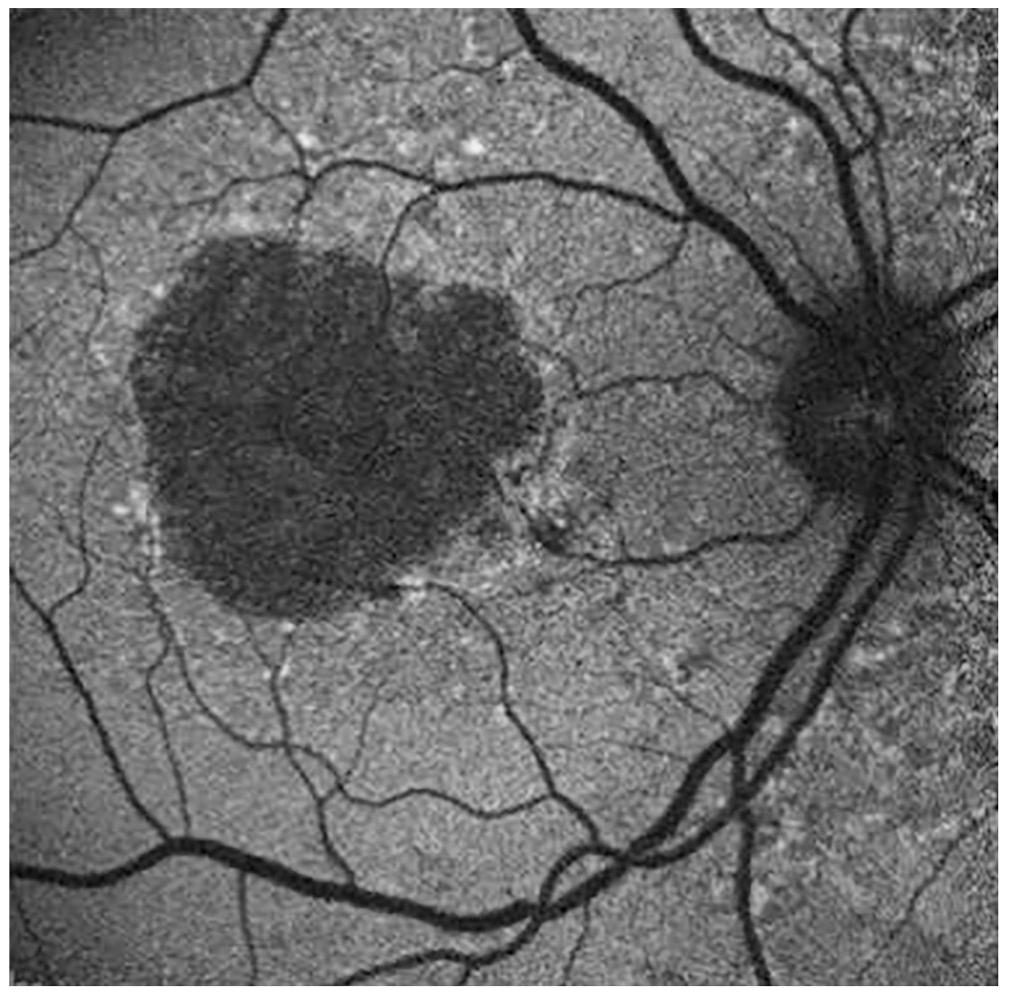
Coğrafik atrofi varlığı, nonspesifik geç dönem YBMD bulgusudur. FOF görüntülemede, coğrafik atrofi alanları kenarları keskin hipootofloresans alanlar olarak gözlenmektedir. Coğrafik atrofi, tek bir hipootofloresans alan şeklinde olabildiği gibi, birden çok hipootofloresans alan şekinde de olabilmektedir. Coğrafik atrofide gelişen RPE kaybına bağlı LF kaybı olmakta, hipootofloresans buna bağlı olarak görülmektedir. ’te, coğrafik atrofinin FOF görünümü izlenmektedir.
Coğrafik atrofi, sıklıkla, santral veya parafoveal maküla bölgesinde görülmekte, bazen peripapiller alana da ilerleyebilmektedir.42 Genellikle parafoveal alanda, yama şeklindeki atrofi alanları birleşerek, “at nalı” veya “yüzük” şeklini alan coğrafik atrofi, zamanla santralde korunan bölgeyi de içerebilmektedir. Coğrafik atrofi alanının, FOF ile ölçümü diğer görüntüleme yöntemlerine göre daha kolay olmaktadır. Bunun sebebi, lezyon sınırlarının net olarak belirlenebilmesidir. FOF görüntülemede, lezyon ve normal retina alanı arasındaki kontrast farkı, atrofik alanların, gelişmiş bilgisayar yazılımları ile ölçümüne imkan tanımaktadır. Bu yazılımlar ile, atrofi alanının zaman içinde ne kadar genişlediği saptanabilmektedir ().
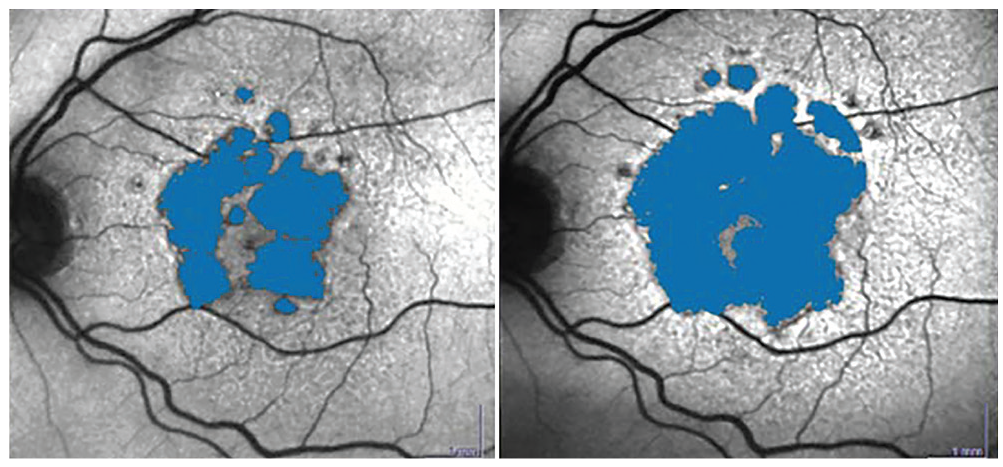
Fovea tutulumu olup olmadığı FOF görüntüleme ile %72-93 sensitivite ve %59-88 spesifite ile belirlenebilmektedir.43 Coğrafik atrofinin foveayı içerip içermediğinin değerlendirilmesi sırasında, her iki FOF yöntemi karşılaştırılmalıdır. Mavi otofloresansta kullanılan kısa dalga boyu, foveadaki pigmentler tarafından absorbe edildiği için, kızılötesi ışığın kullanıldığı uzun dalga boylu otofloresans ile fovea tutulumunun sınırları daha net izlenebilmektedir. ’te coğrafik atrofinin mavi ve kızılötesi FOF görüntüleri izlenmektedir.
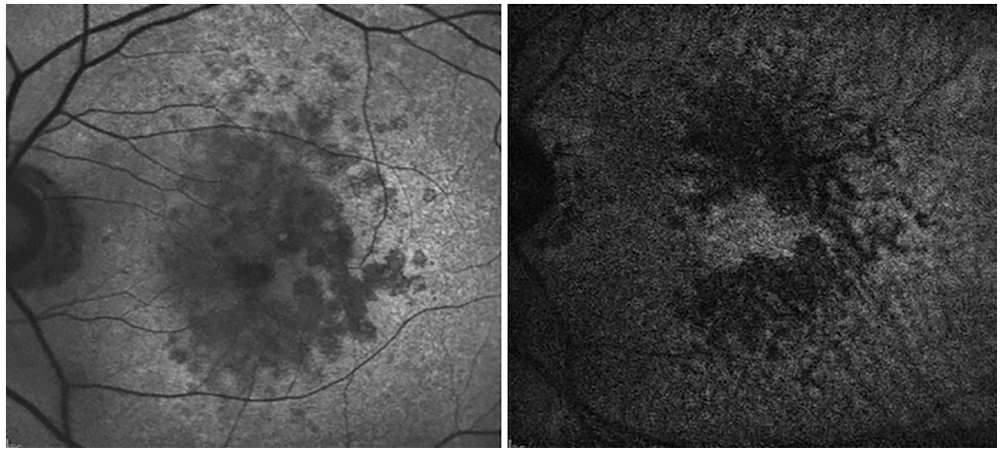
FOF görüntülemede, coğrafik atrofi etrafında hiperotofloresans alanlar görülebilmektedir. Bu durum o alanlarda gelişebilecek hücre ölümü ile ilgili bilgi vermektedir.42 Hiperotofloresans alanlar, küçük noktasal şekilde olabilmekle beraber, geniş düzensiz alanlar şeklinde de olabilmektedir.
Coğrafik atrofi progresyonu için, FOF değerli bir görüntüleme yöntemidir.44 Coğrafik atrofi etrafındaki hiperfloresans alanların genişliği ile hastalığın progresyonu arasında, pozitif korelasyon olduğu gösterilmiştir.45 Hiperotofloresans izlenen bu alanlarda, retina sensitivitesinin de azaldığı, Schmitz-Valckenberg ve ark.46 tarafından bildirilmiştir.
Coğrafik atrofiyi çevreleyen FOF paternleri için, farklı sınıflamalar yapılmıştır. Lois ve ark.47, coğrafik atrofiyi; fokal, artmış, retiküler, kombine ve homojen olarak sınıflamışlardır. Bunun ardından FAM çalışma grubu30, coğrafik atrofi etrafındaki FOF paternleri için bir sınıflama geliştirmiştir. Araştırmacılar FOF paternlerini fokal, bant, yama ve diffüz olmak üzere 4 ayrı grupta incelemişlerdir. Diffüz patern, coğrafik atrofi sınırlarından daha geniş alana uzanan bir fenotipi tariflemekte ve granüler, dallanma, damlama, retiküler ve granüler + periferal punktat noktalar olmak üzere beş ayrı grupta incelenmektedir. Tarif edilen FOF paternlerinden bazılarında progresyon hızının daha fazla olduğu bildirilmiştir. Holz ve ark.48, coğrafik atrofi etrafında hiperotofloresans görülmeyen olgularda, büyüme hızının en az, diffüz ve bant paternlerde ise en fazla olduğunu göstermişlerdir. Buna ek olarak diffüz paternin bir alt grubu olan “diffuse trickling” paterninin progresyon hızının en fazla olduğu bildirilmiştir.48 Batıoğlu ve ark.49, çalışmalarında benzer şekilde “diffuse trickling” ve bant paternlerin progresyon hızının fazla olduğunu bulmuşlardır. ’da diffüz ve bant paternlere birer örnek gösterilmiştir.
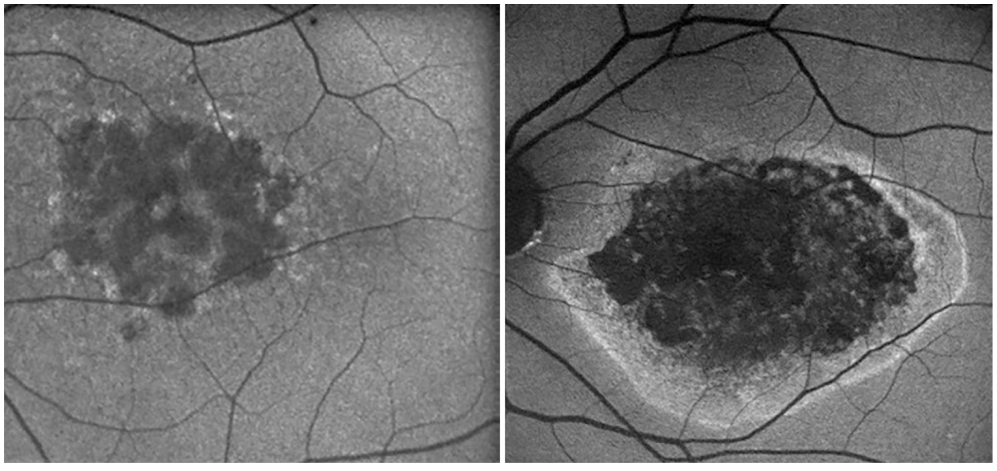
Coğrafik atrofiyi çevreleyen alandaki hiperotofloresansın nedeni ile ilgili, bazı görüşler bulunmaktadır. RPE hücre hipertrofisi, subretinal mesafeye RPE hücrelerinin dökülmesi, melanin ve hücresel debrinin fagositozu, veya tüm bu olayların bir kombinasyonu olabileceği düşünülmektedir.50 FOF görüntülemede izlenen bulgular, genellikle OKT’de dış retinal tabakalardaki değişim ile uyumlu seyretmektedir.50 Görüntüleme yöntemleri birarada değerlendirildiğinde, LF birikimi ile coğrafik atrofi progresyonu arasında bağlantı olduğu düşünülmektedir.
Coğrafik atrofi progresyonunda, güncel retina görüntüleme yöntemlerinden biri olan “fluorescence lifetime imaging ophthalmoscopy” (FLIO), FOF kaybolma zamanını monitörize etmektedir. FOF zamanları in vivo olarak, Heidelberg Engineering oftalmoskopu ile (Heildelberg, Almanya) kaydedilebilmektedir. Çalışma prensibi, zamanla korele tek foton sayımına dayanır. Pulse edilen diod lazer FOF uyarır. Foveayı merkeze alan 30°’lik retina alanında, FOF ömrü ve yoğunluğu incelenebilir. Coğrafik atrofiyi de içeren bir çok retinal hastalık, FLIO ile incelenmiştir.51,52,53 Coğrafik atrofiyi FLIO ile inceleyen çalışmalar, farklı fenotiplerde farklı FLIO paternleri olduğunu göstermiştir.54 Sauer ve ark.55, maküla bölgesinde FOF’nin kısa sürede kaybolmasının maküladaki pigment ile korele olduğunu bildirmişlerdir. Atrofi alanlarında, maküla pigmentinin az olması, uzun FOF süresine sebep olmaktadır. Buna ek olarak kollajen ve elastin içeren skar dokularında da uzun FOF süresi görülmektedir.56
Sauer ve ark.57, çalışmalarında coğrafik atrofiyi çevreleyen hiperotofloresan olmayan olgularda, olanlara göre daha iyi görme keskinliği ve daha kısa FOF süresi olduğunu göstermişlerdir. Bu bölgelerde uzamış FOF kaybolma süresi, RPE hücrelerinde değişimin başladığını gösteriyor olabilir. FOF kaybolma süresinin sağlıklı alan ile atrofik alan arasındaki değişim eğrisi hastalığın prognozuna etki ediyor olabilmektedir. Tüm bu hipotezler gelecekte geniş popülasyonlu çalışmalarda araştırılabilecektir.
Son zamanlarda, sınıflamanın ve tanı konmasının kolaylığı nedeniyle, öğrenme algoritmalarının bir parçası olan derin öğrenme konusu dikkati çekmektedir. Literatürde, oftalmoloji alanında fundus kameranın kullanımı ve retina hastalıklarına otomatik tanı konmasının uygunluğu ile ilgili çalışmalar bulunmaktadır.58 Matsuba ve ark.59, çalışmalarında, YBMD’si olan hastaların, oftalmolojik muayene yapılmadan, derin öğrenme ve Optos görüntüleme yöntemini kullanarak yüksek duyarlılık ile tespitinin mümkün olduğunu bildirmişlerdir.
Medikal ekibin sayıca yetersiz olduğu bölgelerde, geniş açı görüntülerini sağlayabilen fundus kameraları ile YBMD’si olan hastalara tanı koymak mümkün olabilecektir. Görüntüleme yöntemleri ile oluşturulan “telemedicine” sistemi gelecekte gündeme gelecektir. Böylece YBMD tanısı konabilecek, tedavi ve takip planı yapılabilecek, FOF görüntüleri yorumlanarak progresyon ile ilgili bilgi sahibi olunabilecek ve progresyonu yavaşlatıcı veya tedavi edici yeni moleküllerin belli olgularda kullanımı planlanabilecektir.
YBMD’sinde FOF görüntüleme yöntemi, hastalığın prognozu ile ilgili klinisyene fikir vermektedir. Bunun yanında coğrafik atrofi olgularında, lezyonun progresyonu hakkında kalitatif ve kantitatif olarak bilgi veren önemli bir yöntemdir. LF metabolizmasının daha detaylı anlaşılması ve FOF ile saptanan progresyon riski yüksek olan gözlerin belirlenmesi, bu olgularda yeni moleküllerin kullanılması konusunda yol gösterici olacaktır.
Dipnotlar
Etik
Hakem Değerlendirmesi
Hakem Değerlendirmesi: Editörler kurulu dışında olan kişiler tarafından değerlendirilmiştir.
Yazarlık Katkıları
Konsept: F.Ş., Dizayn: F.Ş., N.Ş.K, Veri Toplama veya İşleme: N.Ş.K., Analiz veya Yorumlama: F.Ş., Literatür Arama: N.Ş.K., Yazan: N.Ş.K.
Çıkar Çatışması
Çıkar Çatışması: Yazarlar tarafından çıkar çatışması bildirilmemiştir.
Finansal Destek: Yazarlar tarafından finansal destek almadıkları bildirilmiştir.
The Retinal Pigment Epithelium and Lipofuscin
The RPE consists of a single layer of polygonal cells separating the choroid from the neurosensory retina. It has a critical role in normal retinal functioning, being responsible for phagocytosis and lysosomal destruction of photoreceptor outer segments. Each RPE cell phagocytoses 3 billion outer segments during its lifetime.
With aging, insufficient clearance of the photoreceptor outer segments leads to accumulation of LF in the RPE. LF is a macular fluorophore that absorbs blue light at a wavelength of 470 nm and emits yellow-green light at a wavelength of 600-610 nm. It is a heterogeneous molecule consisting of vitamin A and byproducts of the visual cycle. The accumulation of LF in the RPE lysosomes increases with age, with LF and melanolipofuscin occupying a quarter of the RPE cytoplasm and after the age of 70 years. However, excess LF accumulation is pathological and causes apoptosis in the RPE. The amount of LF is also known to increase in retinal degenerative diseases such as AMD and macular dystrophies such as Best and Stargardt disease.
Although LF is composed of many different molecules, the most important is N-retinyl-N-retinylidene ethanolamine (A2E). A2E is formed in the outer segment of the photoreceptor by the combination of two vitamin A aldehyde (all-trans retinal) molecules with a phosphatidyl ethanolamine. A2E is believed to accumulate in lysosomes because lysosomal enzymes are unable to recognize and degrade it. Another theory to explain the excess accumulation of LF is that the reactive A2E molecule inhibits the metabolism of lysosomal enzymes and inactivates proteolytic enzymes. The accumulation of this substance in the lysosomal compartment of RPE cells is characteristic of the aging process.
Another component of LF, all-trans retinal, is a toxic aldehyde produced in the photoreceptor outer segments as a result of light exposure. As photoreceptors do not have cis-trans isomerase function, all-trans retinal cannot be converted to 11-cis-retinal. All-trans retinal accumulates in the photoreceptor and forms bisretinoids. The oxidation of bisretinoids yields LF. Light-induced photoreceptor loss is known to reduce the accumulation of LF.
LF has other components besides A2E and all-trans retinal. These molecules include A2E precursors, fragments of oxidized A2E molecules, and protein and lipid peroxidation products.
The retinoid fluorophores that form LF are composed of long conjugated bonds. These structures allow retinoid fluorophores to absorb light and then emit fluorescence. Their autofluorescent properties allow LF granules in RPE cells to be detected by fluorescence microscopy.
Fundus Autofluorescence and the Working Principle
In fluorescent microscopy, ultraviolet light is used to detect LF in in vitro examinations. LF excitation can occur at a broad spectrum of wavelengths ranging from 300 nm to 600 nm. Although the emission spectrum is also wide (480-800 nm), its peak is between 600 and 640 nm.
The definition of autofluorescence emerged with the use of fundus FA, while the quantitative evaluation of autofluorescence was performed using fluorometry in 1989 by Kitagawa et al.,
An important factor that prevents the acquisition of clear FAF images is autofluorescence from anatomical structures anterior to the retina, such as the lens. In recent years, improvements in camera systems and new, sophisticated imaging methods have produced clearer FAF images.
Wide-Field Retinal Imaging: Wide-Angle Fundus Cameras
Fundus cameras for retinal imaging were first introduced by Carl Zeiss in 1926. While the first device enabled imaging of a 20-degree area of the fundus, the field of view has expanded with developing technology. Today, many devices used in clinical practice provide 50-degree images. Fundus cameras with a field of view greater than 50 degrees are described as “wide-field”. Devices that image even larger retinal areas, called “ultra-wide-field”, have recently been introduced. One of these devices, the Heidelberg Spectralis (Heidelberg Engineering, Inc., Heidelberg, Germany), can provide 102-degree retinal images. In addition, performing FAF, FA, and indocyanine green angiography examinations with the same device enables evaluation of the choroidal and retinal structures extending to the equator.
Another wide-field imaging system that became commercially available in 2000 is the Optos (Optos PLC, Dunfermline, UK), which includes a cSLO system and allows the retinal periphery to be examined in a single image without pupil dilation or a contact lens. Within the Optos system, an ellipsoid mirror is used to visualize the peripheral retina. This design provides a wide-field image. If the patient is very cooperative and the pupil is well dilated, images up to the ora serrata can be obtained.
In addition to the conveniences it provides, the Optos system has some disadvantages. These include the inability to visualize the entire peripheral retina, the fact that image coloring differs from the actual appearance, and the low posterior pole resolution compared to standard fundus cameras and high-resolution confocal scanning laser systems such as the Spectralis.
Both the Optos and Spectralis systems can provide simultaneous FA and indocyanine green angiography images. Although the Spectralis does not produce clear FAF images with its ultra-wide-field lens system, the 30- and 55-degree FAF images have high resolution.
Confocal Scanning Laser Ophthalmoscopy
The cSLO was developed by Webb et al. and introduced into clinical use by von Rückmann et al. In this system, the retina is scanned with a low-power laser projected from a point source to produce retinal autofluorescence. The reflected light passes through a small aperture (confocal pinhole) located at the focal point of the lens in the device to prevent light scattering, thus providing clear fundus images. The cSLO obtains several images, an average of the sections is created, and the pixel values are normalized to yield a clear image. Although the field of view is 30 degrees, a larger area can be imaged by changing the lens through the system. The cSLO prevents autofluorescent structures anterior to the retina from blocking retinal autofluorescence.
At present, there are many cSLOs that provide FAF images, including the Zeiss SM 30 4024 (ZcSLO, Zeiss, Oberkochen, Germany), Rodenstock cSLO (RcSLO; Rodenstock, Weco, Düsseldorf, Germany), Heidelberg Retinal Angiography System (HRA classic, HRA 2, Spectralis®, Heidelberg Engineering, Dossenheim, Germany), F-10 (Nidek, Aichi, Japan), and Optomap® Panoramic 200 Tx (Optomap; Optos, Scotland).
The excitation light of the HRA 2 is blue solid-state diode laser with a wavelength of 488 nm and acquires FAF images with a 500 nm barrier filter. The Spectralis® (Spectralis SD-OCT, Heidelberg Engineering GMbH, Heidelberg, Germany) device synchronizes cSLO and optical coherence tomography (OCT) images, unlike the HRA 2.
The fluorophores in the retina emit fluorescence in a wide spectrum of wavelengths. Therefore, depending on the excitation wavelength, the fluorophores producing the autofluorescence change and the FAF image may vary. The most commonly used excitation light is blue light (488 nm) and is called blue autofluorescence (also known as short-wave autofluorescence, blue-AF, short wave-AF). In blue autofluorescence, excitation is at 488 nm (blue light) and emission is between 500 and 800 nm with a peak at 630 nm. A peak is observed at this wavelength because LF emits at 630 nm.
Near-infrared autofluorescence (NIR-AF) uses a 787 nm excitation wavelength and 800 nm emission filter. The main fluorophore for NIR-AF is melanin. Fluorescence is more pronounced in the choroid and RPE due to the high density of melanin. In NIR-AF imaging, RPE atrophy appears as a reduced signal, but a low-level signal may be detected due to melanin in the choroid.
Recently, the use of green light (504 nm and 532 nm) has been introduced and adapted to wide-field retinal imaging systems. Because green light is absorbed less by macular pigments than blue light, it can provide a better evaluation of the LF signal in the macula. Therefore, green autofluorescence can reveal changes in fovea more clearly. The lower energy of the green excitation light also makes the patient more comfortable during imaging.
Fundus Autofluorescence Appearance of the Healthy Fundus
1. Appearance of the healthy fundus on short-wave (blue) autofluorescence:
In the healthy fundus, diffuse autofluorescence is most intense between 5 and 15 degrees from the fovea. The optic nerve and retinal vessels are hypoautofluorescent because the optic nerve does not contain LF and blood blocks autofluorescence.
Xanthophylls (lutein and zeaxanthin) protect the photoreceptor and RPE cells in the fovea by filtering blue light, eliminating free radicals, and masking the natural autofluorescence of the subfoveal RPE cells. The blue light used in short-wave autofluorescence is absorbed by xanthophylls. These pigments are dense in the fovea, resulting in hypoautofluorescence in this area. In addition, the density of melanin in the fovea also causes light to be absorbed.
Due to the density of melanin, the fovea appears hyperautofluorescent. The RPE cells in the macula are more cylindrical and contain less LF and more melanin, unlike the periphery. Similar to short-wave autofluorescence imaging, the optic disc and retinal vessels are also hypoautofluorescent on NIR-AF.
Less of the light used in NIR-AF is absorbed by media opacities due to its long wavelength. Geographic atrophy lesions appear brighter than non-atrophic areas and the lesion margins in the fovea are more clearly distinguishable. There is less contrast in short-wave autofluorescence imaging. Figure 1 shows FAF images of a normal fundus.
Clinical Use of Fundus Autofluorescence Images
FAF images can be examined to obtain information about the RPE. Hypoautofluorescence indicates a decrease in RPE cells and/or low concentration of LF. RPE atrophy appears hypoautofluorescent. In addition, the presence of fibrosis, intraretinal fluid, pigment, and blood are also factors that impede autofluorescence. Situations and conditions that cause hyper- and hypoautofluorescence are presented in Table 1.
Increased autofluorescence is observed in conditions with LF accumulation, such as Stargardt disease, Best disease, and adult vitelliform macular dystrophy. Hyperautofluorescence is also observed in the presence of drusen and macular edema. In eyes with geographic atrophy, areas of hyperautofluorescence can be observed surrounding the atrophic area. Changes in autofluorescence have also been demonstrated in the peripheral fundus of eyes with AMD.
Use of Fundus Autofluorescence in Dry Age-Related Macular Degeneration
According to the Beckman classification, AMD was classified as the early, intermediate, and late stage. In this classification, the presence of small drusen (drupelet, <63 µm) is considered a normal age-related change. The presence of medium-sized drusen (≥63 to <125 µm) was defined as early AMD, while the intermediate stage is defined as the presence of large drusen (≥125 µm) or medium-sized drusen together with pigmentary changes.
Imaging Pigmentary Changes with Fundus Autofluorescence
Hyperpigmentation in AMD can cause typical focal, linear, and/or lace-like hyperautofluorescence in FAF images. Changes in FAF are thought to be due to the presence of melanolipofuscin. Melanolipofuscin accumulation may not be uniform. Autofluorescence may vary depending on whether its melanin content is high or low.
Hypopigmented areas show hypoautofluorescence due to RPE degeneration or reduced LF.
Fundus Autofluorescence Imaging in Early and Intermediate AMD
The imaging of drusen, which is an early finding of AMD, is important as it can provide clues regarding progression to the late stage. Drusen has subtypes such as soft, refractile, basal laminar, and cuticular drusen. Reticular pseudodrusen (RPD) located under the retina is another subtype of drusen. Drusen can be differentiated using multimodal imaging methods including color fundus photography, fundus FA, near-infrared reflectance, FAF, and OCT.
On FAF imaging, drusen can have different appearances. A hyperautofluorescent appearance can be seen due to LF within the drusen or in the RPE overlying the drusen. A hypoautofluorescent appearance is caused by regressed drusen or degenerated RPE cells.
Small and medium-sized drusen can produce variable FAF images and may sometimes be overlooked. Different appearances on FAF suggest that the drusen contents may also be different. Soft drusen appear as areas of hyperautofluorescence that is slightly more pronounced at the periphery than the center on FAF imaging. Cuticular drusen are punctate and hypoautofluorescent. Drusenoid pigment epithelium detachment shows a patchy pattern of hyper- and hypoautofluorescent areas.
Reticular pseudodrusen, which differs from other drusen types by its subretinal location, is thought to be a risk factor for progression to late stage AMD. FAF imaging is known to be more sensitive than color fundus photography in demonstrating the presence of RPD. Studies have shown that the presence of reticular drusen is an important risk factor for late stage AMD., RPD appear as small, yellowish-white, round or oval lesions on fundus examination. On FAF imaging, they appear as multiple clusters of small (50-400 µm diameter, usually <200 µm), regularly arranged, homogeneous round or oval areas with low-contrast hypofluorescence. They are located mostly in the superior part of the fovea, their prevalence increases with age, and they are more common in women. In early AMD, the presence of RPD is called the “reticular pattern” due to its characteristic appearance in FAF imaging. Although it is not clear why reticular drusen appear hypoautofluorescent, it is thought to be due to the accumulation of subretinal deposits that block the LF in the RPE. Figure 2 shows RPD imaged by cSLO.
The frequency of RPD in eyes with geographic atrophy suggests that this finding is associated with the disease. However, the mechanism of RPD formation and its effect on disease progression have not been determined.
FAF changes in cases of early AMD were classified in an international study. The International Fundus Autofluorescence Classification Group (IFAG) identified eight different autofluorescence patterns in these patients: normal, minimal change, focal increase, patchy, linear, lace-like, reticular, and speckled. Based on this study, it was predicted that in areas of abnormal autofluorescence, damage started at the RPE level. This classification of early AMD can provide clues about the prognosis of the disease.
The most common finding in intermediate AMD is areas with spots of increased autofluorescence (87.9%). Punctate areas of decreased autofluorescence (26.7%) and linear areas of increased autofluorescence (19.8%) are also observed to a lesser extent.
FAF findings have been reported to provide insight regarding neovascular transformation. Analysis using FAF was reported to be the most sensitive method for identifying conversion to neovascularization compared to other imaging methods (color fundus photography, FA, indocyanine green angiography, and OCT. Batioglu et al. showed that the patchy, linear, and reticular FAF patterns were at high risk of transformation into choroidal neovascular membranes. FAF phenotypes identified in early and intermediate AMD provide information about disease prognosis and may be useful for informing the patient and determining follow-up intervals.
Use of Fundus Autofluorescence in Geographic Atrophy
The presence of geographic atrophy is a nonspecific finding of late AMD. In FAF imaging, geographic atrophy appears as well-defined areas of hypoautofluorescence. There may be a single or multiple hypoautofluorescent areas. In geographic atrophy, RPE loss results in LF loss, thus the hypofluorescent appearance. Figure 3 shows a FAF image of geographic atrophy.
Geographic atrophy is frequently seen in the central or parafoveal macula, sometimes progressing to the peripapillary region. Generally, patchy areas of geographic atrophy in the parafoveal area merge to form horseshoe or ring patterns, but over time may also affect the spared central zone. Geographic atrophy area is easier to measure with FAF than other imaging methods. This is because the lesion margins can be clearly determined. The contrast between the lesion and the normal retina in FAF imaging allows atrophic areas to be measured with advanced computer software. With these programs, enlargement of the atrophy area over time can be determined (Figure 4).
The presence or absence of foveal involvement can be determined by FAF imaging with 72-93% sensitivity and 59-88% specificity. Both FAF methods should be compared when assessing whether geographic atrophy involves the fovea. Because the short wavelength used in blue autofluorescence is absorbed by pigments in the fovea, the boundaries of foveal involvement can be more clearly observed with the long wavelength used in NIR-AF. Figure 5 shows blue and infrared FAF images of geographic atrophy.
FAF imaging can reveal hyperfluorescent areas around geographic atrophy. This suggests that cell death may occur in those areas. The hyperautofluorescent areas may be punctate or large irregular areas.
FAF is a valuable imaging method in terms of geographic atrophy progression. The extent of the hyperfluorescent areas around the geographical atrophy was shown to be positively correlated with disease progression. Schmitz-Valckenberg et al. reported that retinal sensitivity was also reduced in these areas of hyperautofluorescence.
Different classifications have been described for FAF patterns surrounding geographic atrophy. Lois et al. classified geographic atrophy as focal, increased, reticular, combined, and homogeneous. Subsequently, the FAM study group developed a classification for FAF patterns around geographic atrophy. The researchers examined FAF patterns in four different groups: focal, band, patchy, and diffuse. The diffuse pattern describes a phenotype extending over a wider area than the geographic atrophy boundaries and is examined in five groups: granular, branching, trickling, reticular, and granular + peripheral punctate dots. Some of the described FAF patterns have been associated with a faster rate of progression. Holz et al. showed that the enlargement rate was lowest in eyes with no hyperautofluorescence around the geographic atrophy and highest in those with the diffuse and band patterns. In addition, they reported that the “diffuse trickling” pattern, a subgroup of diffuse pattern, had the highest progression rate. Similarly, Batıoğlu et al. observed high rates of progression of the diffuse trickling and band patterns. Figure 6 shows an example of the diffuse and band patterns.
There are different views about the cause of hyperfluorescence in the area surrounding geographic atrophy. RPE cell hypertrophy, RPE cell shedding into the subretinal space, phagocytosis of melanin and cellular debris, or a combination of all these events has been proposed. Findings observed on FAF imaging are generally consistent with changes in the outer retinal layers on OCT. Evaluating imaging methods together suggests a correlation between LF accumulation and geographic atrophy progression.
One of the current retinal imaging methods used to monitor the progression of geographic atrophy is fluorescence lifetime imaging ophthalmoscopy (FLIO), which measures FAF decay time. FAF times can be recorded in vivo with the Heidelberg Engineering ophthalmoscope (Heidelberg, Germany). The working principle is based on time-correlated single photon counting. With pulsed diode laser stimulation, the FAF lifetime and density can be examined in the 30-degree retinal area centered on the fovea. Several retinal diseases, including geographic atrophy, have been studied with FLIO.,, Studies examining geographical atrophy with FLIO have shown that different phenotypes display different FLIO patterns. Sauer et al. reported that rapid FAF decay in the macular region was correlated with pigment in the macula. In atrophic areas, the low macular pigment density results in a long FAF lifetime. In addition, long FAF lifetime is seen in scar tissues containing collagen and elastin.
Sauer et al. demonstrated in their study that eyes without hyperfluorescence surrounding the geographic atrophy had better visual acuity and shorter FAF lifetime than those with. The prolonged FAF lifetime in these regions may indicate the onset of change in the RPE cells. A slope of change in FAF lifetime between the unaffected and atrophic areas may be prognostic. All of these hypotheses can be investigated in future studies with large populations.
Deep learning, which is a type of machine learning algorithm, has recently attracted attention due to the ease of classification and diagnosis. There are studies in the ophthalmology literature on the use of fundus cameras and the suitability of the automatic diagnosis of retinal diseases. Matsuba et al. reported in their study that patients with AMD could be detected with high sensitivity using deep learning and Optos imaging, without ophthalmological examination.
In areas with insufficient numbers of medical personnel, wide-field fundus cameras will enable the diagnosis of patients with AMD. A telemedicine system based on imaging methods will be on the agenda in the future. Thus, it will be possible to diagnose AMD, plan treatment and follow-up, interpret FAF images to gain information about progression, and plan the use of new molecules that slow or treat progression in selected patients.
FAF imaging helps the clinician estimate the prognosis of AMD and is a valuable method that provides qualitative and quantitative information about the progression of geographic atrophy. Gaining a more detailed understanding of LF metabolism and identifying eyes at high risk of progression as detected by FAF will guide the use of new molecules in these patients.
Kaynakça
Machemer R, Norton EW, Gass JD, Choromokos E. Pseudofluorescence--a problem in interpretation of fluorescein angiograms. Am J Ophthalmol. 1970;70:1-10.
Feeney L. The phagolysosomal system of the pigment epithelium. A key to retinal disease. Invest Ophthalmol. 1973;12:635-638.
Krebs I. Noemi Lois and John V. Forrester: Fundus autofluorescence. Graefes Arch Clin Exp Ophthalmol. 2011;249:309.
Delori FC, Dorey CK, Staurenghi G, Arend O, Goger DG, Weiter JJ. In vivo fluorescence of the ocular fundus exhibits retinal pigment epithelium lipofuscin characteristics. Invest Ophthalmol Vis Sci. 1995;36:718-729.
Wing GL, Blanchard GC, Weiter JJ. The topography and age relationship of lipofuscin concentration in the retinal pigment epithelium. Invest Ophthalmol Vis Sci. 1978;17:601-607.
Eldred GE, Lasky MR. Retinal age-pigments generated by self-assembling lysosomotrophic detergents. Nature. 1993;361:724-726.
Sparrow JR, Vollmer-Snarr HR, Zhou J, Jang YP, Jockusch S, Itagaki Y, Nakanishi K. A2E-epoxides damage DNA in retinal pigment epithelial cells. Vitamin E and other antioxidants inhibit A2E-epoxide formation. J Biol Chem. 2003;278:18207-18213.
Strauss O. The retinal pigment epithelium in visual function. Physiol Rev. 2005;85:845-881.
Lambris JD, Adamis AP. Inflammation and retinal disease: complement biology and pathology. In: Advances in Experimental Medicine and Biology. New York NY; Springer; 2010:63-74.
Katz ML, Eldred GE. Retinal light damage reduces autofluorescent pigment deposition in the retinal pigment epithelium. Invest Ophthalmol Vis Sci. 1989;30:37-43.
Liu J, Itagaki Y, Ben-Shabat S, Nakanishi K, Sparrow JR. The biosynthesis of A2E, a fluorophore of aging retina, involves the formation of the precursor, A2-PE, in the photoreceptor outer segment membrane. J Biol Chem. 2000;275:29354-29360.
Bindewald-Wittich A, Han M, Schmitz-Valckenberg S, Snyder SR, Giese G, Bille JF, Holz FG. Two-photon-excited fluorescence imaging of human RPE cells with a femtosecond Ti:Sapphire laser. Invest Ophthalmol Vis Sci. 2006;47:4553-4557.
Marmorstein AD, Marmorstein LY, Sakaguchi H, Hollyfield JG. Spectral profiling of autofluorescence associated with lipofuscin, Bruch’s membrane, and sub-RPE deposits in normal and AMD eyes. Invest Ophthalmol Vis Sci. 2002;43:2435-2441.
Machemer R, Norton EW, Gass JD, Choromokos E. Pseudofluorescence-a problem in interpretation of fluorescein angiograms. Am J Ophthalmol. 1970;70:1-10.
Kitagawa K, Nishida S, Ogura Y. In vivo quantitation of autofluorescence in human retinal pigment epithelium. Ophthalmologica. 1989;199:116-121.
Ciardella A, Brown D. Wide field imaging. In: Agarwal A, ed. Fundus Fluorescein and Indocyanine Green Angiography: A Textbook and Atlas. New York; Slack Incorporated; 2007:79-83.
Witmer MT, Kiss S. Wide-field Imaging of the Retina. Surv Ophthalmol. 2013;58:143-154.
Friberg TR, Pandya A, Eller AW. Non-mydriatic panoramic fundus imaging using a non-contact scanning laser-based system. Ophthalmic Surg Lasers Imaging. 2003;34:488-497.
von Rückmann A, Schmidt KG, Fitzke FW, Bird AC, Jacobi KW. Dynamics of accumulation and degradation of lipofuscin in retinal pigment epithelium in senile macular degeneration. Klin Monbl Augenheilkd. 1998;213:32-37.
Schmitz-Valckenberg S, Fitzke FW. Imaging techniques of fundus autofluorescence. In: Lois N, Forrester JV, eds. Fundus autofluorescence. Philadelphia; Lippincott Williams & Wilkins; 2009:48-60.
Bellmann C, Rubin GS, Kabanarou SA, Bird AC, Fitzke FW. Fundus autofluorescence imaging compared with different confocal scanning laser ophthalmoscopes. Br J Ophthalmol. 2003;87:1381-1386.
Nandakumar N, Buzney S, Weiter JJ. Lipofuscin and the principles of fundus autofluorescence: a review. Semin Ophthalmol. 2012;27:197-201.
Keilhauer CN, Delori FC. Near-infrared autofluorescence imaging of the fundus: Visualization of ocular melanin. Invest Ophthalmol Vis Sci. 2006;47:3556-3564.
Ravera V, Giani A, Pellegrini M, Oldani M, Invernizzi A, Carini E, Cigada M, Bottoni F, Staurenghi G. Comparison among different diagnostic methods in the study of type and activity of choroidal neovascular membranes in age-related macular degeneration. Retina. 2019;39:281-287.
Pfau M, Goerdt L, Schmitz-Valckenberg S, Mauschitz MM, Mishra DK, Holz FG, Lindner M, Fleckenstein M. Green-light autofluorescence versus combined blue-light autofluorescence and near-infrared reflectance imaging in geographic atrophy secondary to age-related macular degeneration. Invest Opthalmol Vis Sci. 2017;58:121-130.
Schmitz-Valckenberg S, Holz FG, Bird AC, Spaide RF. Fundus autofluorescence imaging: Review and perspectives. Retina. 2008;28:385-409.
Rothenbuehler SP, Wolf-Schnurrbusch UE, Wolf S. Macular pigment density at the site of altered fundus autofluorescence. Graefes Arch Clin Exp Ophthalmol. 2011;249:499-504.
Bone RA, Landrum JT, Cains A. Optical density spectra of the macular pigment in vivo and in vitro. Vision Res. 1992;32:105-110.
Chen SF, Chang Y, Wu JC. The spatial distribution of macular pigment in humans. Curr Eye Res. 2001;23:422-434.
Holz FG, Bindewald-Wittich A, Fleckenstein M, Dreyhaupt J, Scholl HP, Schmitz-Valckenberg S; FAM-Study Group. Progression of geographic atrophy and impact of fundus autofluorescence patterns in age-related macular degeneration. Am J Ophthalmol. 2007;143:463-472.
Küçükiba K, Erol N, Bilgin M. Yaşa Bağlı Makula Dejenerasyonu Olan Hastalarda Periferal Retina Değişikliklerinin Ultra-geniş Açılı Fundus Otofloresans Görüntüleri ile Değerlendirilmesi. Turk J Ophthalmol. 2020;50:6-14.
Ferris FL 3rd, Wilkinson CP, Bird A, Chakravarthy U, Chew E, Csaky K, Sadda SR; Beckman Initiative for Macular Research Classification Committee. Clinical classification of age-related macular degeneration. Ophthalmology. 2013;120:844-851.
Batioglu F, Demirel S, Ozmert E, Oguz YG, Ozyol P. Autofluorescence patterns as a predictive factor for neovascularization. Optom Vis Sci. 2014;91:950-955.
Bindewald A, Bird AC, Dandekar SS, Dolar-Szczasny J, Dreyhaupt J, Fitzke FW, Einbock W, Holz FG, Jorzik JJ, Keilhauer C, Lois N, Mlynski J, Pauleikhoff D, Staurenghi G, Wolf S. Classification of fundus autofluorescence patterns in early age-related macular disease. Invest Ophthalmol Vis Sci. 2005;46:3309-3314.
Curcio CA, Messinger JD, Sloan KR, McGwin G, Medeiros NE, Spaide RF. Subretinaldrusenoid deposits in non-neovascular age-related macular degeneration. Retina. 2013;33:265-276.
Forte R, Querques G, Querques L, Massamba N, Letien V, Souied EH. Multimodal imaging of dry age-related macular degeneration. Acta Ophthalmol. 2012;90:281-287.
Hogg RE, Silva R, Staurenghi G, Murphy G, Santos AR, Rosina C, Chakravarthy U. Clinical characteristics of reticular pseudodrusen in the fellow eye of patients with unilateral neovascular age-related macular degeneration. Ophthalmology. 2014;121:1748-1755.
Knudtson MD, Klein R, Klein BE, Lee KE, Meuer SM, Tomany SC. Location of lesions associated with age-related maculopathy over a 10-year period: the Beaver Dam Eye Study. Invest Ophthalmol Vis Sci. 2004;45:2135-2142.
Ueda-Arakawa N, Ooto S, Tsujikawa A, Yamashiro K, Oishi A, Yoshimura N. Sensitivity and specificity of detecting reticular pseudodrusen in multimodal imaging in Japanese patients. Retina. 2013;33:490-497.
Bingöl Kızıltunç P, Şermet F. Yaşa Bağlı Makülopatide Fundus Otofloresans Bulguları. Turk J Ophthalmol. 2018;48:304-308.
Cachulo L, Silva R, Fonseca P, Pires I, Carvajal-Gonzales S, Bernardes R, Cunha-Vaz JG. Early markers of choroidal neovascularization in the fellow eye of patients with unilateral exudative age-related macular degeneration. Ophthalmologica. 2011;225:144-149.
Mauschitz MM, Fonseca S, Chang P, Göbel AP, Fleckenstein M, Jaffe GJ, Holz FG, Schmitz-Valckenberg S; GAP Study Group.Topography of geographic atrophy in age-related macular degeneration. Invest Ophthalmol Vis Sci. 2012;53:4932-4939.
Khanifar AA, Lederer DE, Ghodasra JH, Stinnett SS, Lee JJ, Cousins SW, Bearelly S. Comparison of color fundus photographs and fundus autofluorescence images in measuring geographic atrophy area. Retina 2012;32:1884-1891
Olcay K, Çakır A, Sönmez M, Düzgün E, Yıldırım Y. Kuru Tip Yaşa Bağlı Makula Dejenerasyonu Hastalarında Otofloresans Görüntüleme Yöntemleri ile Lezyon Progresyon Hızının Değerlendirilmesi. Turk J Ophthalmol. 2015;45:235-238.
Bearelly S, Khanifar AA, Lederer DE, Lee JJ, Ghodasra JH, Stinnett SS, Cousins SW. Use of fundus autofluorescence images to predict geographic atrophy progression. Retina. 2011;31:81-86.
Schmitz-Valckenberg S, Bültmann S, Dreyhaupt J, Bindewald A, Holz FG, Rohrschneider K. Fundus autofluorescence and fundus perimetry in the junctional zone of geographic atrophy in patients with age-related macular degeneration. Invest Ophthalmol Vis Sci. 2004;45:4470-4476.
Lois N, Owens SL, Coco R, Hopkins J, Fitzke FW, Bird AC. Fundus autofluorescence in patients with age-related macular degeneration and high risk of visual loss. Am J Ophthalmol. 2002;133:341-349.
Holz FG, Bindewald-Wittich A, Fleckenstein M, Dreyhaupt J, Scholl HP, Schmitz-Valckenberg S; FAM-Study Group. Progression of geographic atrophy and impact of fundus autofluorescence patterns in age-related macular degeneration. Am J Ophthalmol. 2007;143:463-472.
Batıoğlu F, Gedik Oğuz Y, Demirel S, Ozmert E. Geographic Atrophy Progression in Eyes with Age-Related Macular Degeneration: Role of Fundus Autofluorescence Patterns, Fellow Eye and Baseline Atrophy Area. Ophthalmic Res. 2014;52:53-59.
Brar M, Kozak I, Cheng L, Bartsch DU, Yuson R, Nigam N, Oster SF, Mojana F, Freeman WR. Correlation between spectral domain optical coherence tomography and fundus autofluorescence at the margins of geographic atrophy. Am J Ophthalmol. 2009;148:439-444.
Dysli C, Schuerch K, Escher P, Wolf S, Zinkernagel MS. Fundus Autofluorescence Lifetime Patterns in Retinitis Pigmentosa. Invest Ophthalmol Vis Sci. 2018;59:1769-1778.
Dysli C, Berger L, Wolf S, Zinkernagel MS. Fundus Autofluorescence Lifetimes and Central Serous Chorioretinopathy. Retina. 2017;37:2151-2161.
Schmidt J, Peters S, Sauer L, Schweitzer D, Klemm M, Augsten R, Müller N, Hammer M. Fundus autofluorescence lifetimes are increased in non-proliferative diabetic retinopathy. Acta Ophthalmol. 2017;95:33-40.
Dysli C, Wolf S, Zinkernagel MS. Autofluorescence Lifetimes in Geographic Atrophy in Patients With Age-Related Macular Degeneration. Invest Ophthalmol Vis Sci. 2016;57:2479-2487.
Sauer L, Schweitzer D, Ramm L, Augsten R, Hammer M, Peters S. Impact of Macular Pigment on Fundus Autofluorescence Lifetimes. Invest Ophthalmol Vis Sci. 2015;56:4668-4679.
Schweitzer D. Metabolic mapping. In: Holz F, Spaide R, eds. Medical retina. Berlin; Heilderberg: Springer; 2010:107-123.
Sauer L, Klemm M, Peters S, Schweitzer D, Schmidt J, Kreilkamp L, Ramm L, Meller D, Hammer M. Monitoring foveal sparing in geographic atrophy with fluorescence lifetime imaging ophthalmoscopy - a novel approach. Acta Ophthalmol. 2018;96:257-266.
Ohsugi H, Tabuchi H, Enno H, Ishitobi N. Accuracy of deep learning, a machine-learning technology, using ultra-wide-field fundus ophthalmoscopy for detecting rhegmatogenous retinal detachment. Sci Rep. 2017;7:9425.
Matsuba S, Tabuchi H, Ohsugi H, Enno H, Ishitobi N, Masumoto H, Kiuchi Y. Accuracy of ultra-wide-field fundus ophthalmoscopy assisted deep learning, a machine-learning technology, for detecting age-related macular degeneration. Int Ophthalmol. 2019;39:1269-1275.