
Öz
Koroid tabakası gözün fizyopatolojisinde önemli bir rol oynamaktadır. Multimodal görüntülemede kullanılan değişik teknikler ile koroid farklı özellikleriyle incelenebilir. Fundus fluoresein anjiografi, retina pigment epitelinin bariyer özelliği nedeniyle fundusun derin tabakalarını görüntüleyememektedir. Bu nedenle koroid yapısının anjiografik incelenmesinde indosiyanin yeşil anjiografi (İSYA) kullanılmaktadır. Koroidin ve retinanın başta dejeneratif, tümöral ve enflamatuvar olmak üzere birçok hastalıklarının tanı ve tedavisinde İSYA multimodal görüntülemenin önemli bir bileşenidir. Bu derleme yazısı İSYA’nın genel özellikleri ve klinikteki kullanımına pratik bir yaklaşım sunmaktadır.
Anahtar Kelimeler: İndosiyanin yeşil, anjiografi, koroid, retina, tanı, tedavi, görüntüleme
Giriş
İndosiyanin yeşil (İSY) boyası, kalp ve karaciğer fonksiyon testlerinde uzunca süredir uygulanmasına karşın oftalmolojiye anjiografi boyası olarak girmesi yaklaşık 40 yıl öncesine dayanmaktadır.1,2,3
Koroid damarlarından sınırlı sızma özelliği ile infrared ışıkla kombine edildiğinde, ksantofil pigmenti ve retina pigment epitelinde (RPE) çok az absorbe edilerek derin tabakalara nüfus etme yeteneği, koroid dolaşımının incelenmesinde İSY anjiografiye (İSYA) avantaj sağlar. Bununla birlikte İSY boyasının düşük floresans yoğunluğu nedeniyle kaliteli görüntü elde edilmesindeki güçlükler bu yöntemin oftalmik tanıda yerini almasını geciktirmiştir.
İnfrared duyarlı yüksek resolüsyon gücündeki fundus kameralarının ve “scanning laser ophthalmoscopy” (SLO) tekniğinin bu yöntem ile kombine edilmesi sayesinde İSYA koroid vasküler yapısının fizyopatolojik süreçlerinin tanı ve izlenmesinde yerini almıştır.3,4,5,6 Geniş açıya imkan veren objektiflerin uygulamaya girmesi de İSYA’nın kullanım alanını genişletmiştir.
Arka segment hastalıklarının tanı ve tedavisi yapılan merkezlerde İSYA, multimodal görüntülemenin önemli bir bileşenidir. Sunulan yazı ile İSYA’nın temel özellikleri ve klinik kullanımdaki rolü üzerine bilgi verilmesi amaçlanmaktadır.
Sonuç
Gözün fizyopatolojsinde yüklendiği önemli role karşın koroid dolaşımını inceleyen tanı yöntemleri rutin oftalmolojik tanıya aynı yoğunlukta girmemiştir. Bu eksiklik fonksiyonunun önemsenmemesinden çok, kullanılan tekniklerin yetersiz kalmasından kaynaklanmıştır. 70’li yıllarda İSYA’nın oftalmolojiye kazandırılmasına karşın, teknik güçlükler gelişmesini geciktirmiştir. Son yıllarda geliştirilen yüksek zaman ve mekan resolusyon kapasitesindeki cihazlar mükemmel bir görüntü kalitesi sağlamıştır. Sofistike ve pahalı görüntüleme cihazlarına ve deneyimli uygulayıcılara gerek göstermesi İSYA’nın klinik uygulamada yaygınlık kazanmasının önündeki en önemli engelleri oluşturmaktadırlar. Tüm bu zorluklara karşın sağladığı bilgiler İSYA’yı fundusun incelenmesinde multimodal görüntülemenin önemli bir ögesi yapmıştır.
Dipnotlar
Etik
Finansal Destek: Yazar tarafından finansal destek almadığı bildirilmiştir.
Physical and Chemical Properties of ICG
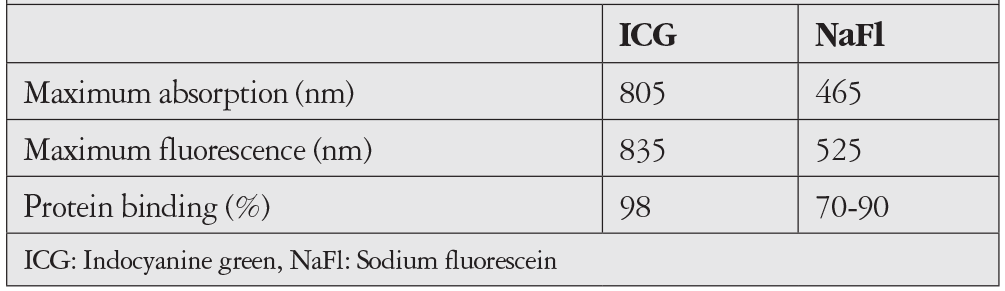
ICG is a tricarbocyanine dye with a molecular weight of 775 g/mol and chemical formula of C43H47N2NaO6S2. It differs from sodium fluorescein (NaFl) in two main ways. First is its high rate of plasma protein bonding, which is 98% for ICG compared to 70-90% for NaFl., The second important difference is that its maximum absorption is at 805 nm and its maximum fluorescence is at 835 nm, which is in the near-infrared part of the electromagnetic spectrum. For NaFl, these wavelengths are 465 nm and 525 nm, respectively (Table 1).
Unlike NaFl, ICG shows very little leakage from choroidal and pathological vessels due to its high plasma protein binding. Light at its maximum fluorescence wavelength of 835 nm is not absorbed by macular xanthophyll pigments and only 10% is absorbed by the RPE. These features of ICG together with its ability to penetrate into the deep tissues enable visualization of the choroidal vascular structures, especially the submacular area where NaFl is insufficient.
ICG Metabolism
ICG is excreted from the body exclusively by the liver. In people with normal liver function, the half-life of ICG in the circulation is approximately 2.6 minutes. Its rapid elimination from the circulation allows angiography to be repeated after a short time when needed.
ICGA Procedure
After dissolving crystallized ICG in 5 mL of solvent, a bolus of 25-50 mg or 1-2 mg/kg is administered via the antecubital vein. Some researchers follow this with an injection of 5 mL of sterile saline solution.
The early phase is very short, so even if no dye is observed in the fundus at 10 seconds after ICG administration, serial images should be obtained and the light level should be kept as low as possible during imaging. This reduces the “blooming artifact” (i.e., a white field that obscures detail) which occurs due to choroidal fluorescence in the first few seconds after the dye reaches the choroid. Dark images can be improved by adjusting the light and contrast during the angiography analysis phase. Immediately after the first early phase images are obtained in one eye, imaging of the fellow eye should be started. Afterwards, ICGA images should be acquired at 1-minute intervals until minute 5 and then typically at 5-minute intervals from minute 10 to 20. These intervals can be adjusted according to the characteristics of each case. Pseudostereoscopic imaging may be helpful in the analysis.
Some devices allow fluorescein angiography (FA) and ICGA to be performed simultaneously. Although this may be advantageous when interpreting the angiograms, it is rarely done in practice. A disadvantage of this method is the difficulty of revealing the exact cause of a side effect after injecting two different dyes at the same time.
ICGA recordings can also be obtained as video, which enables the determination of circulation times and a dynamic examination of the vasculature. This allows the feeding vessels of vascular anomalies to be identified more easily, and can also demonstrate the pulsation feature of lesions such as polypoidal choroidal vasculopathy (PCV).
Side Effects of ICGA
ICGA has a safer side effect profile compared to FA. Moderate side effects have been reported at a rate of 1:63, serious side effects at a rate of 1:1900, and death at a rate of 1:222000 after FA.
Adverse effects after the use of ICG are rare. Rates of mild, moderate, and severe reactions have been reported as 0.15%, 0.02%, and 0.05-0.07%, respectively.,
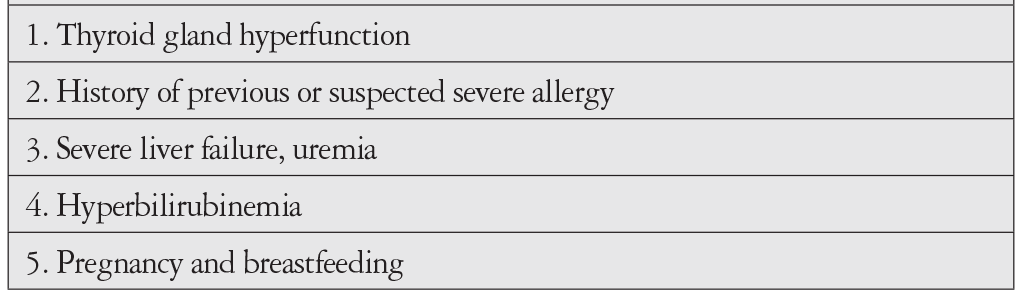
ICG dye contains up to 5% sodium iodide as an additive to prevent recrystallization. Therefore, caution should be exercised considering the potential side effects in patients with thyroid hyperfunction. Thyroid function tests performed after ICGA give inaccurate results. On the other hand, it is argued that since iodine is naturally found in the human body, there can be no risk of antibody formation or the development of an immune-mediated allergic reaction against it. The allergies that develop after consuming shellfish and other seafood are attributed to the proteins in the food, not the iodine.
The cause of side effects following ICGA has not been fully explained. Non-allergic histamine release due to iodine or ICG, IgE-mediated hypersensitivity, complement system activation, or the release of other inflammation mediators are suggested mechanisms.
Moreover, although very rare, adequate preparation is necessary in the event of anaphylactic shock after ICG injection.
ICG dye can also be prepared without the addition of iodine, but severe side effects have also been reported after iodine-free ICGA.
As ICG separates bilirubin from protein in in vitro studies, it should not be administered to preterm infants and neonates who require transfusion due to hyperbilirubinemia. The indication should also be reviewed in patients with uremia, severe liver failure, or a history of severe multiple allergy (Table 2).
It has been reported that ICG shows minimal passage across the placenta and that the placenta has a protective effect against its passage to the fetus. Although there is no proven teratogenic effect, its indication for use in pregnancy should be carefully discussed.
Non-specific side effects following angiographic dye delivery are usually recorded as allergic reactions. This leads to the restriction of new angiographic examinations needed in the future. For this reason, it is important to reevaluate a patient’s history of post-angiography side effects and other possible factors in detail.
ICGA Phases
Early phase: Filling of the choroidal arteries, choriocapillaris, and choroidal veins. It includes the few seconds after the ICG dye reaches the choroidal circulation.
Middle phase: Late venous phase, lasting up to minute 10. In this phase, contrast differences between the choroidal vessels and background fluorescence decrease slowly.
Late phase: Between 10 and 20 minutes. The fundus is dominated by homogeneous fluorescence (i.e., isofluorescence). Hypofluorescent silhouettes of the large choroidal veins are observed on this background. This phase is also called the inversion phase due to the reversal of the contrast pattern.
ICGA Interpretation
The logic of ICGA and FA interpretation is similar. However, because the infrared excitation light used in ICGA penetrates beneath the RPE and ICG shows less leakage due to high plasma protein binding, the images appear more “whitish” in the early phase compared to FA in normal eyes. The contrast between the vascular structures and the background is low. ICGA interpretation should be made in conjunction with color fundus photographs and FA images from the same eye. In eyes that have undergone multimodal imaging, these data should also be considered when interpreting ICGA.
Hypofluorescence: Appears as dark or black areas caused by filling defects and blockage. Filling defects (i.e., failure of the ICG dye to reach the vessel) is mostly seen in pathologies that directly affect the circulation of the choriocapillaris. Blocked hypofluorescence is the result of a formation that prevents tissue fluorescence from reaching the imaging device. A pigmented lesion in the fundus (e.g., choroidal nevus), thick subretinal hemorrhage, or infiltrations in the choroidal stroma are the most common causes.
Hyperfluorescence: Appears as a white area. Window defect often causes the underlying vascular structures to appear brighter after thinning or atrophy of the RPE or choriocapillaris. The best example of this is that in age-related macular degeneration (AMD), large choroidal veins in atrophic areas show more hyperfluorescence than the choroidal vessels observed in other areas of the macula. Leakage can be observed in severe stromal choroiditis, although it is considerably less with ICG compared to FA. Another cause of hyperfluorescence is abnormal vessel formations, such as choroidal hemangioma or nodular formations in PCV.
ICGA in Clinical Practice
1. Neovascular Age-Related Macular Degeneration
ICGA was used extensively in the mid-90s to visualize occult CNVs. Hyperfluorescent lesions (generally referred to as “hot spots”) that appear in the middle phase and are smaller than one disc diameter were considered to be the active part of occult CNV. A larger “plaque” type lesion seen in the late phase was considered the silent or less active component of the occult CNV., Another application area, dynamic ICGA, enabled visualization of CNV feeder vessels. However, after the results of laser photocoagulation to both hot spots and feeder vessels demonstrated its limited effectiveness and the superiority of photodynamic therapy to laser photocoagulation, the use of ICGA in neovascular AMD declined.
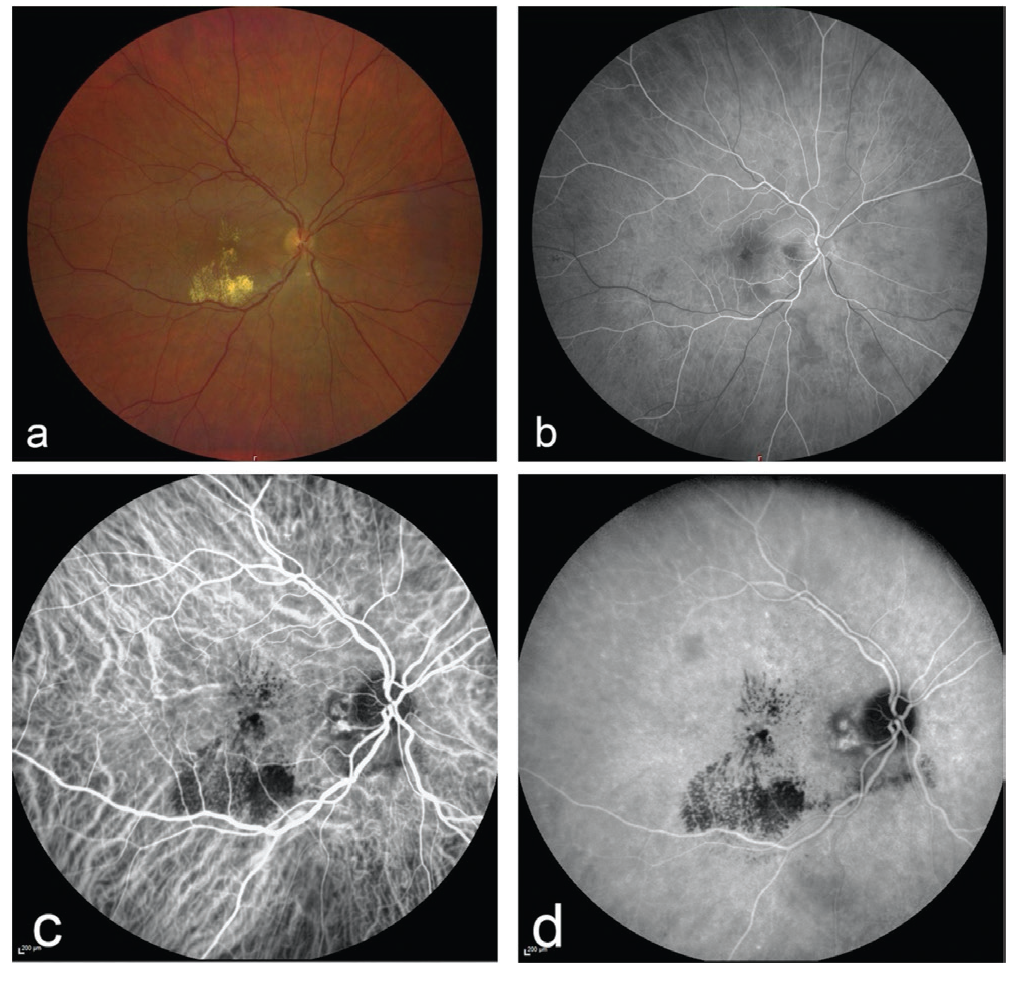
ICGA has an important place in the differential diagnosis of neovascular AMD subgroups. ICGA can demonstrate nodular hyperfluorescent lesions in PCV and the accompanying abnormal vascular network (Figure 1).
In type 3 CNV or retinal angiomatous proliferation lesions, the retinochoroidal vascular anomaly can be visualized more clearly with ICGA than FA due to the low leakage.
In recent years, the causal relationship between pachychoroid (thick choroid) and neovascular AMD has been intensively studied. ICGA plays an important role in visualizing the choroidal vasculature in the macula.
2. Central Serous Chorioretinopathy
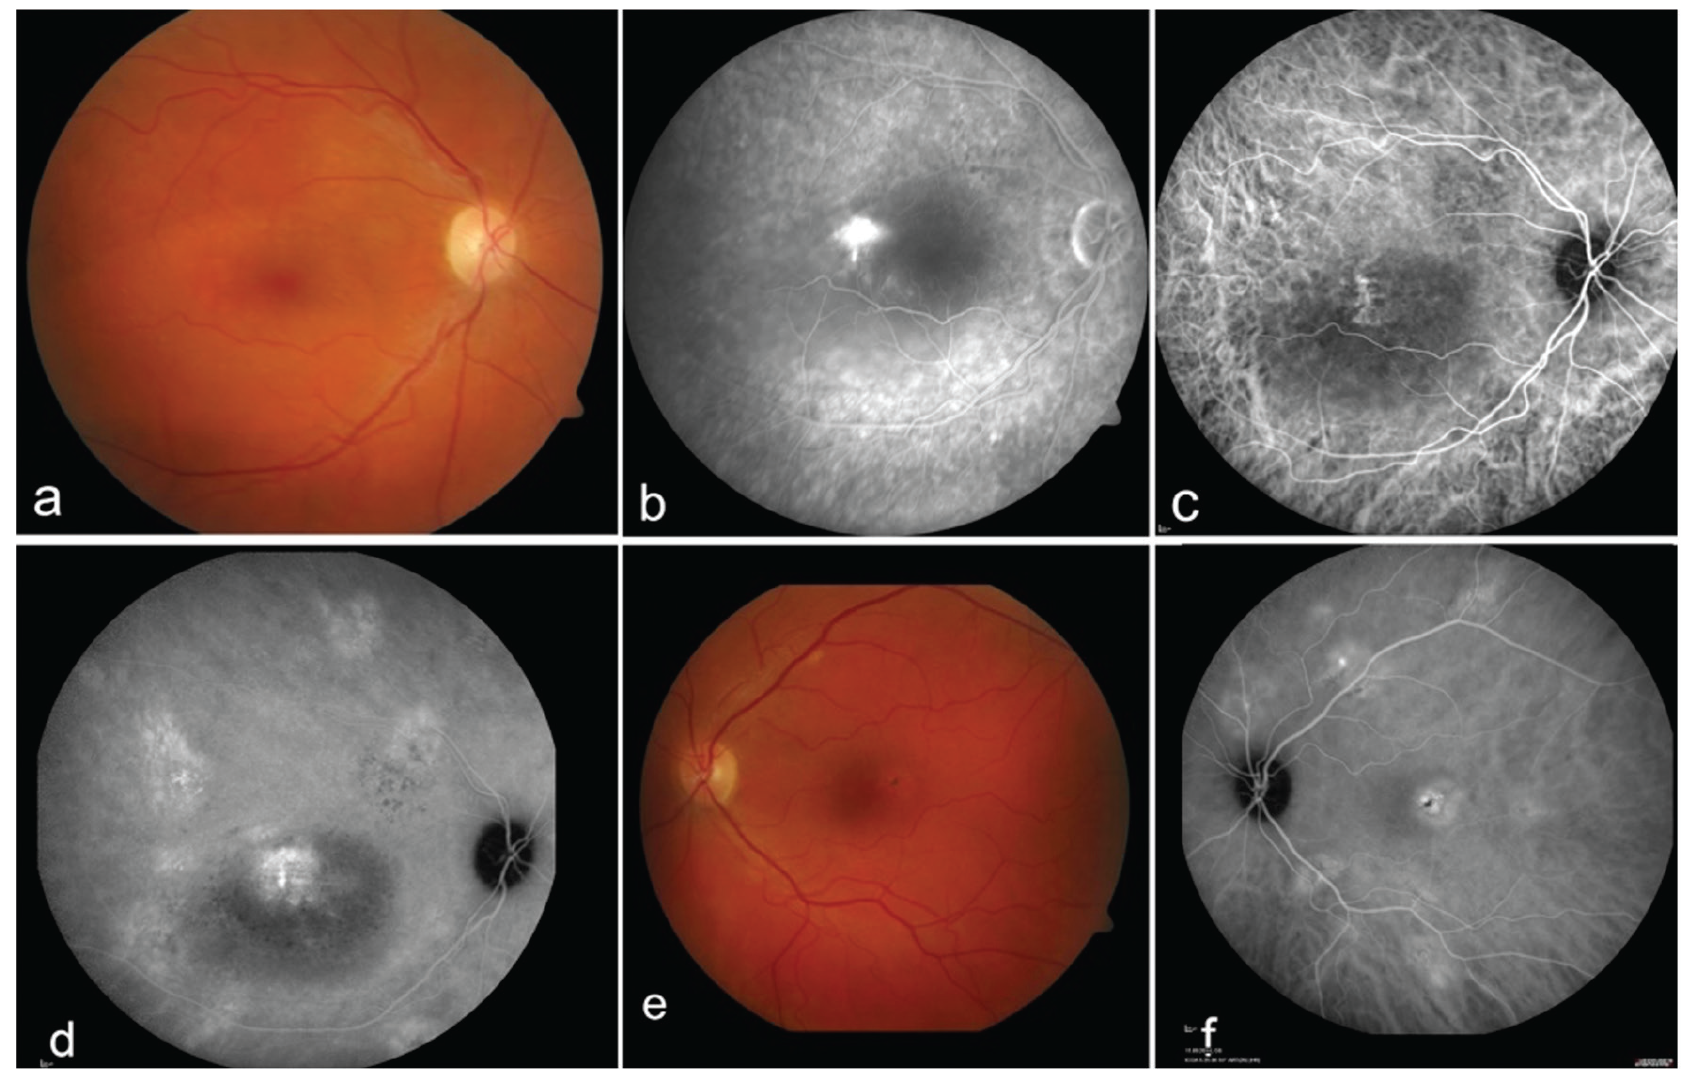
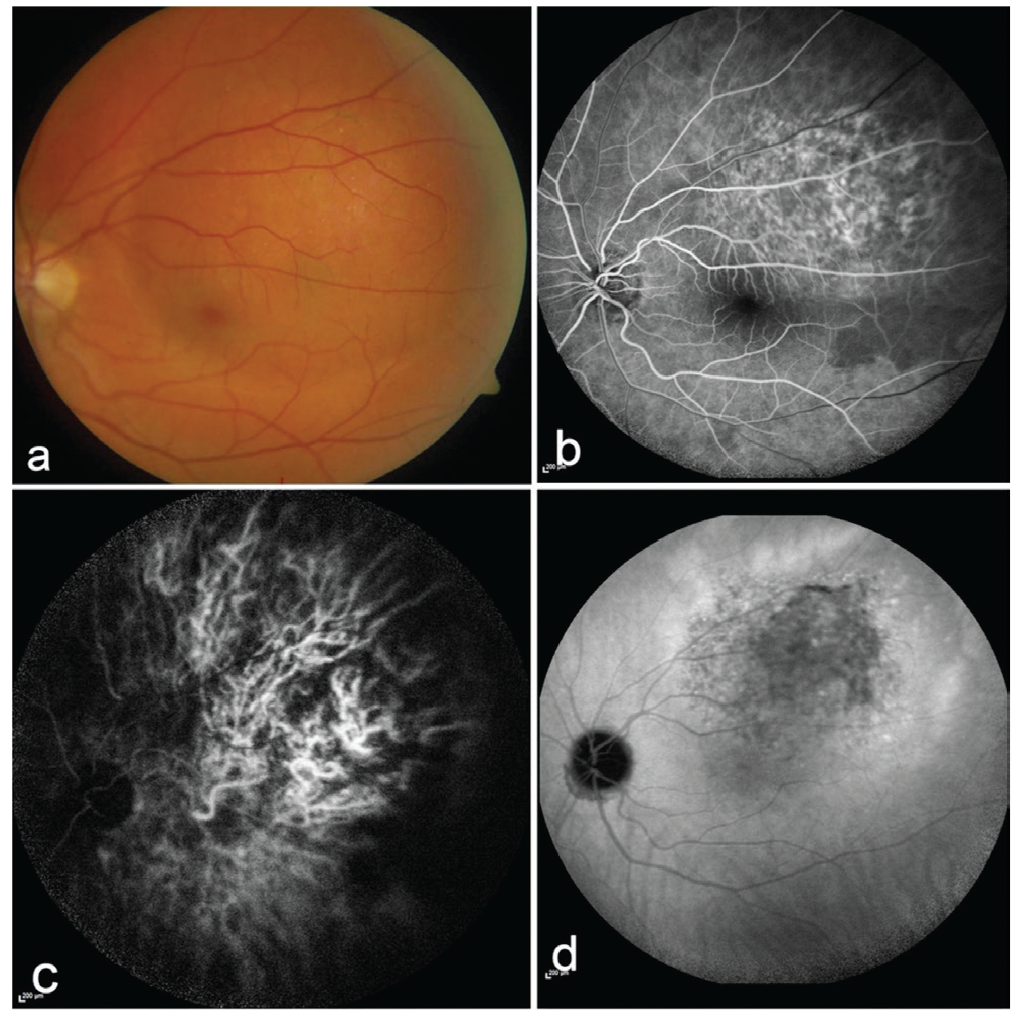
Although the pathogenesis is not completely understood, exudation resulting from permeability of the choroidal vasculature in CSCR causes RPE detachment and serous retinal detachment. Areas of leakage in the choroid can be visualized in more detail with ICGA compared to FA (Figure 2). The hyperfluorescent areas detected on ICGA reveal targets for the application of photodynamic therapy. Due to their choroidal thickening, ICGA plays a central role in the differentiation of CSCR, PCV, and other pachychoroidal entities.,
In cases of neovascular AMD that do not respond to treatment with anti-vascular endothelial growth factors, ICGA imaging is also used for the differential diagnosis of possible PCV, CSCR, or secondary CNV associated with CSCR.
3. Choroidal Inflammation
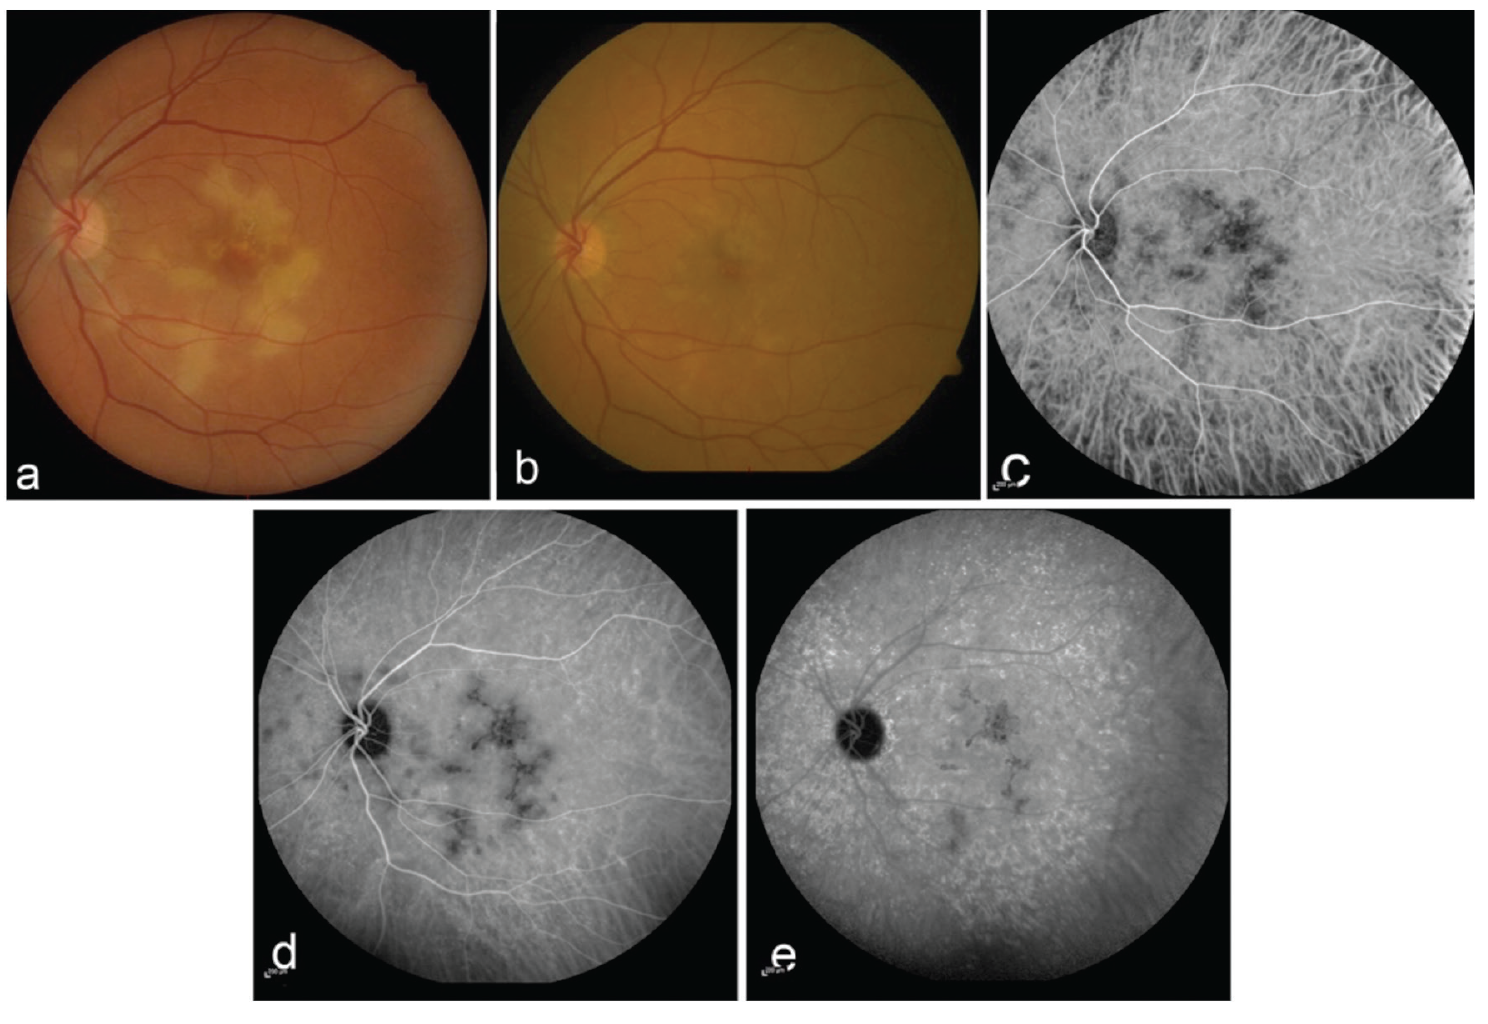
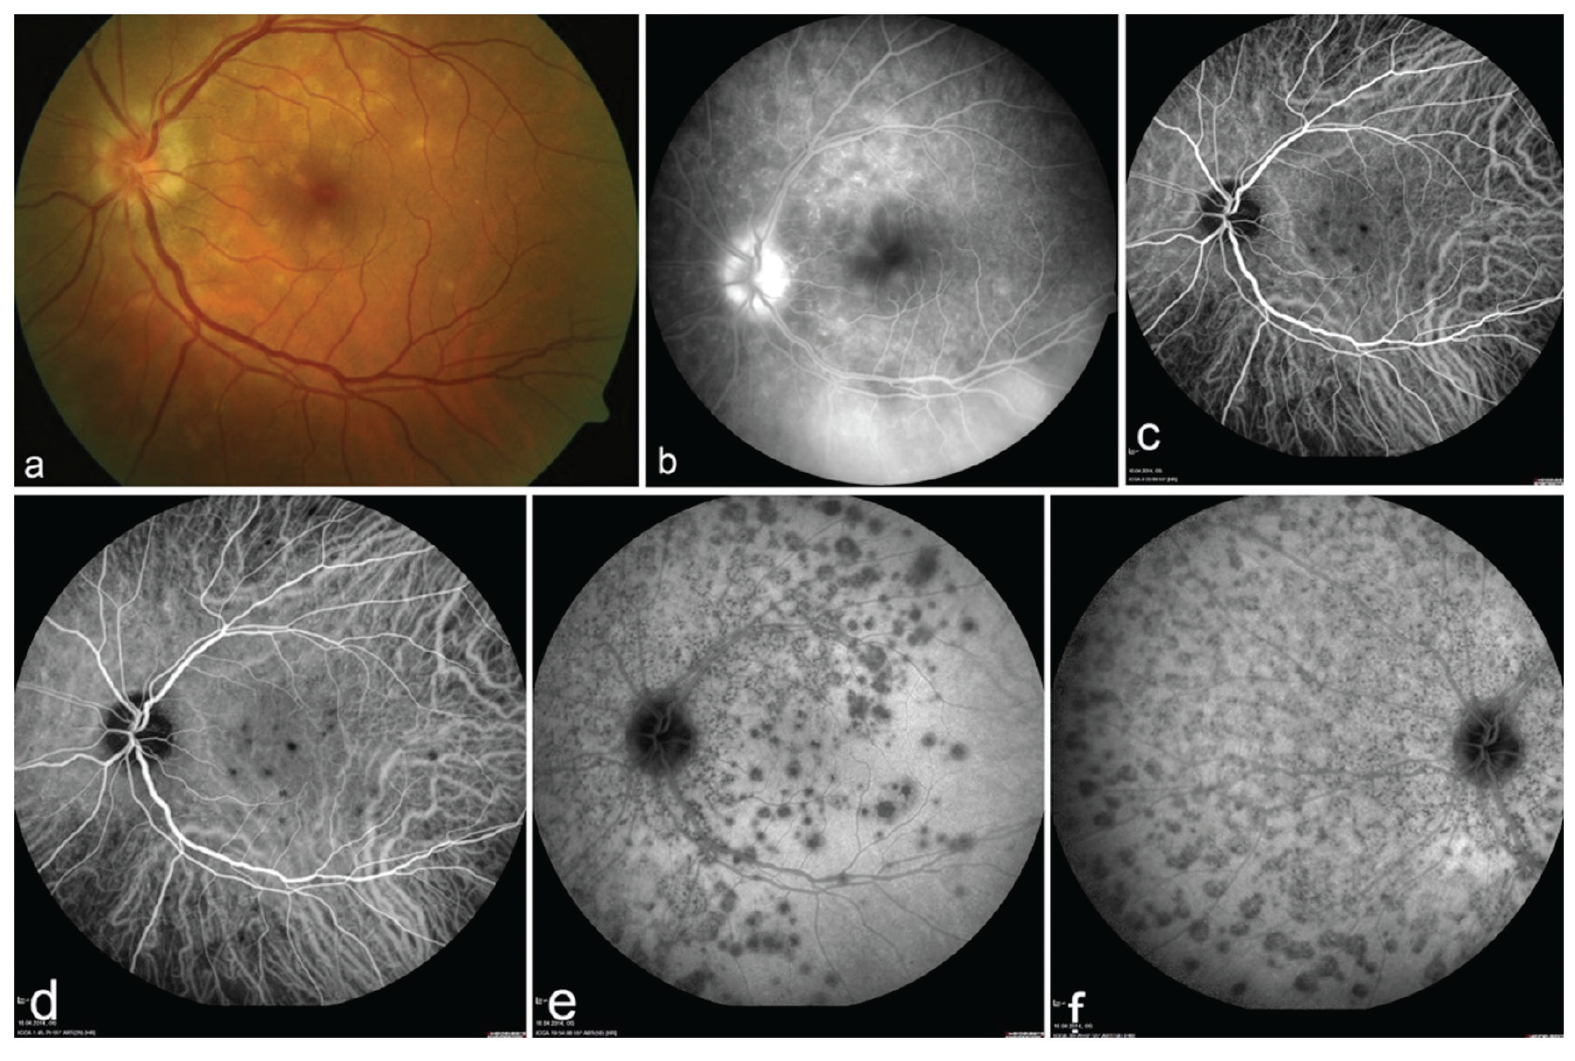
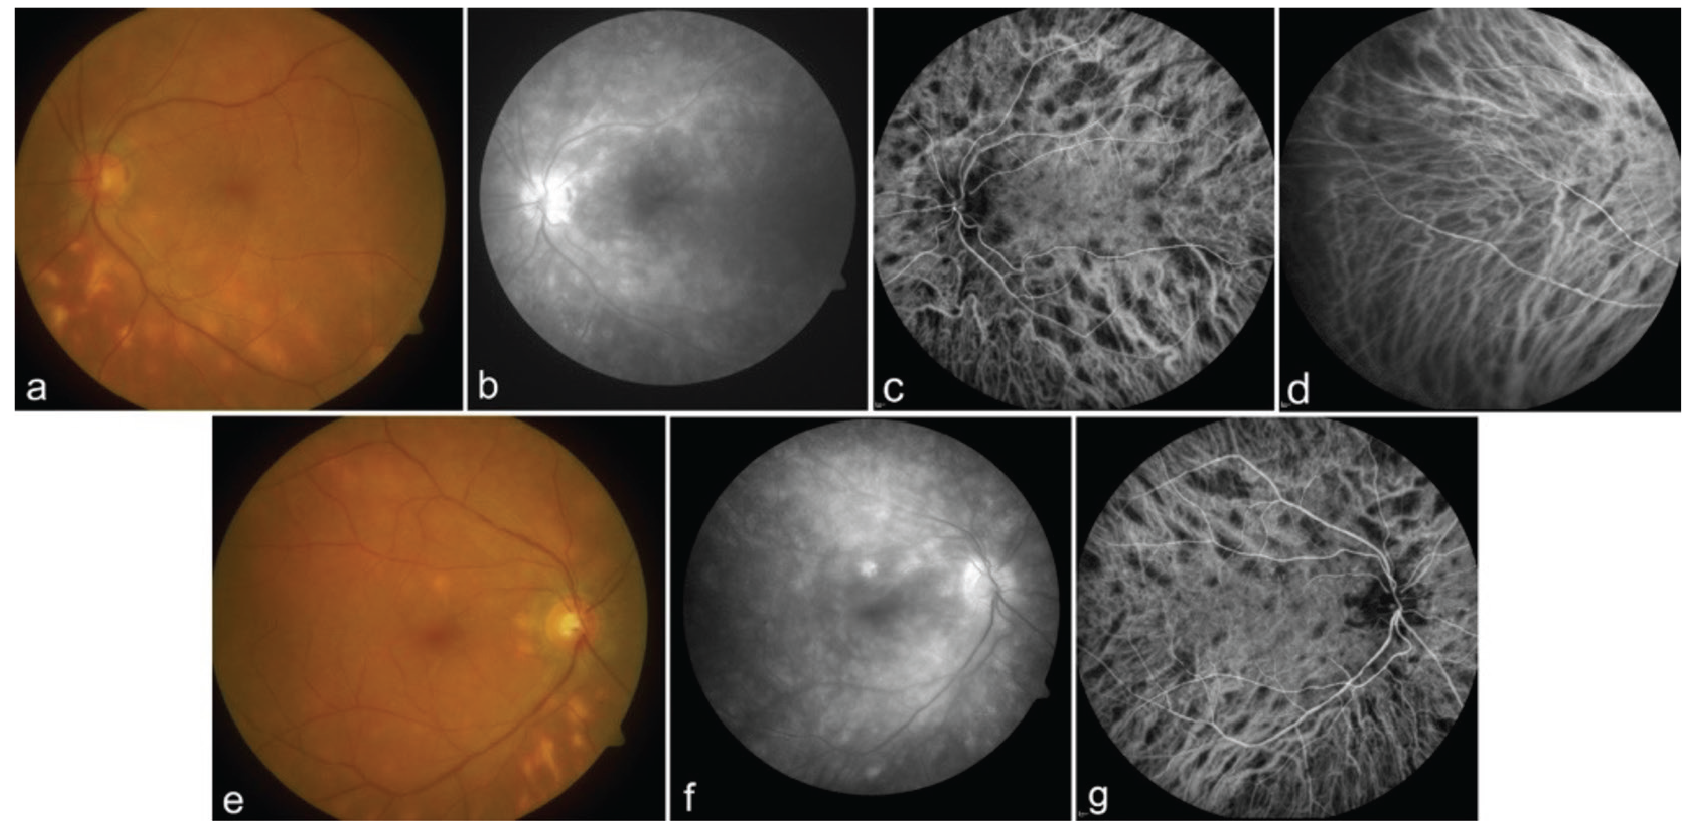
Due to the limited blocking effect of the RPE layer, ICGA plays an important role in the evaluation of inflammatory events in the choroid. Diseases affecting the choriocapillary structure, such as acute posterior multifocal posterior pigment epitheliopathy (APMPPE) or multiple evanescent white dot syndrome (MEWDS), cause reduced choriocapillaris perfusion that manifests as filling defect and hypofluorescence (Figures 3, 4). Diseases that cause infiltration and granuloma formation in the choroidal stroma, such as birdshot retinochoroidopathy (Figure 5) and Vogt-Koyanagi-Harada disease (VKH), also present with hypofluorescent lesions due to blocked fluorescence. The number, shape, size, location, and laterality of hypofluorescence lesions are important in the evaluation of ICGA. Inflammations that involve the choroidal stroma and follow an aggressive course (e.g., VKH disease) may cause leakage from the large choroidal veins, resulting in diffuse hyperfluorescence and vessel staining in the choroid. If in cases of multiple white dot diseases ICGA does not yield pathognomonic features, then findings in other organ systems, retinal involvement, multimodal imaging methods (especially FA, optical coherence tomography, and autofluorescence) and demographic characteristics should also be evaluated.
4. Intraocular Tumors
The most important contribution of ICGA is in the diagnosis of choroidal hemangiomas. ICGA particularly helpful in the differential diagnosis of thin, amelanotic fundus tumors and choroidal metastases from choroidal hemangioma., In the choroidal filling phase, the tumor shows rapid, bright hyperfluorescence. In the late phase, the intensity of hyperfluorescence decreases as the ICG dye leaves the vessels (“wash-out phenomenon”). This feature enables the differentiation of choroidal hemangioma from amelanotic malignant melanoma of the choroid (Figure 6).
In cases where FA is insufficient or cannot be applied, ICGA also facilitates the examination of vascular tumors of the fundus. Due to rapid leakage and masking, FA has limited ability to determine the topographic location and vascular structure of pathologies that present with intense exudation at the papillary margin and retinal thickening. ICGA is advantageous in recognizing lesions because of the deep penetration and low leakage of ICG. Thus, it aids in the differential diagnosis of masses and pathologies around the optic disc, such as juxtapapillary retinal capillary angioma, PCV, and CNV.
5. Hemorrhagic Diseases of the Fundus
Retinal arterial macroaneurysms may cause bleeding in the posterior segment. They may be located in the inferior or superior temporal arcade and can usually be recognized as white-yellowish round formations along the arteries. However, in cases where intense hemorrhage covers the lesion or blocks FA, ICGA can be used to visualize the vascular anomaly despite bleeding. Distinguishing retinal artery macroaneurysms from CNV and PCV in hemorrhages localized to the macula is an important area of use of ICGA.
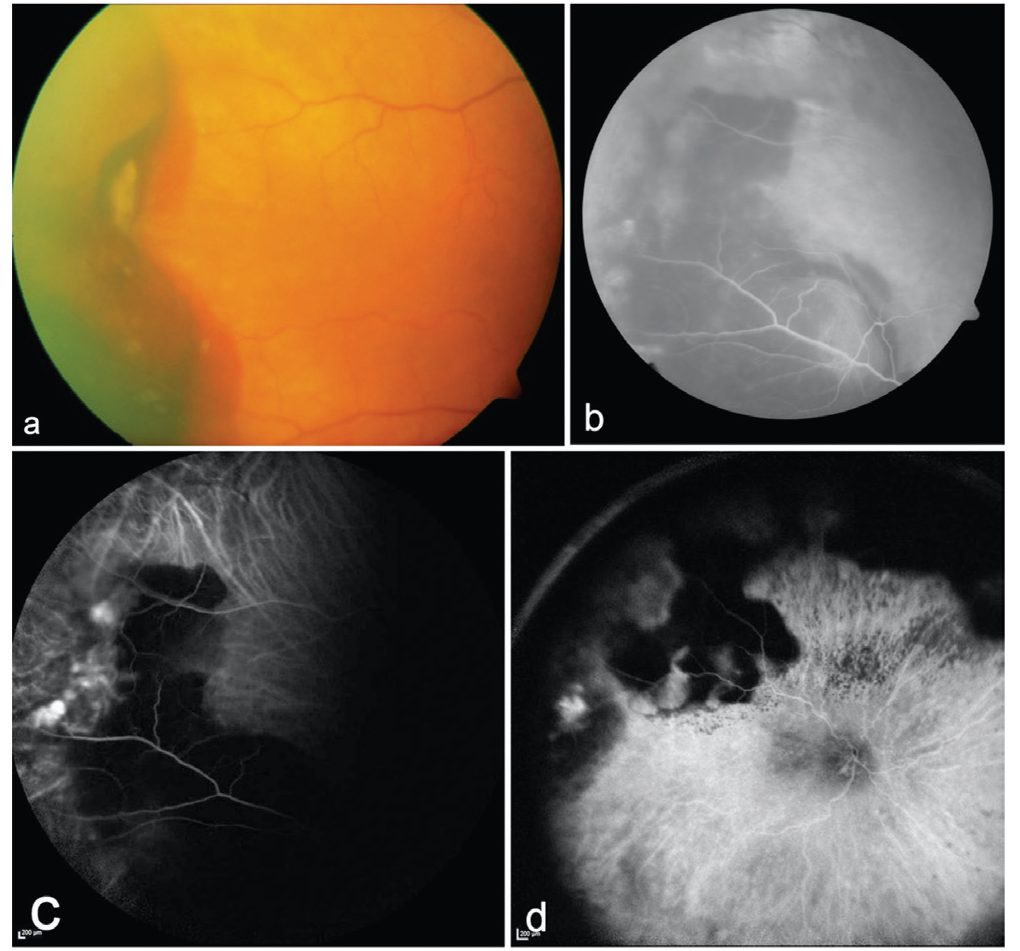
ICGA is also used as a diagnostic tool for the differentiation of CNV, PCV, and vasoproliferative retinal tumors in eyes with large hemorrhagic lesions in the peripheral fundus (Figure 7).
6. Unexplained Vision Loss
In patients with unexplained vision loss, ICGA can be performed if choroidal involvement is suspected and other multimodal diagnostic methods are inconclusive.
Kaynakça
Fox IJ, Brooker LG, Heseltine DW, Essex HE, Wood HE. A tricarbocyanine dye for continuous recording of dilution curves in whole blood independent of variations in blood oxygen saturation. Proc Staff Meet Mayo Clin. 1957;32:478-484.
Flower RW, Hochheimer BF. A clinical technique and apparatus for simultaneous angiography of the separate retinal and choroidal circulations. Invest Ophthalmol. 1973;12:248-261.
Bischoff PM, Flower RW. Ten years experience with choroidal angiography using indocyanine green dye: a new routine examination or an epilogue? Doc Ophthalmol. 1985;60:235-291.
Destro M, Puliafito CA. Indocyanine green videoangiography of choroidal neovascularization. Ophthalmology. 1989:96:846-853.
Scheider A, Schroedel C. High resolution indocyanine green angiography with a scanning laser ophthalmoscope. Am J Ophthalmol. 1989;108:458-459.
Yannuzzi LA, Slakter JS, Sorenson JA, Guyer DR, Orlock DA. Digital indocyanine green videoangiography and choroidal neovascularization. Retina. 1992;12:191-223.
Kogure K, Choromokos E. Infrared absorption angiography. J Appl Physiol. 1969;26:154-157.
Kogure K, David NJ, Yamanouchi U, Choromokos E. Infrared absorption angiography of the fundus circulation. Arch Ophthalmol. 1970;83:209-214.
David NJ. Infra-red absorption fundus angiography. In: Amalric P, ed. Fluorescein angiography:Proceedings of the Int’l Symposium, Albi, France Basel: Karger; 1969:189-192.
Hochheimer BF. Angiography of the retina with indocyanine green. Arch Ophthalmol. 1971;86:564-565.
Tokoro T, Hayashi K, Okuyama F. Recording ICG angiograms by means of infrared sensitive video camera. Proceedings of the workshop on clinical choroidal angiography, Alicante, Spain ,October,1984;20-28.
Hayashi K, de Laey JJ. Indocyanine green angiography of submacular choroidal vessels in the human eye. Ophthalmologica. 1985;190:20-29.
Hayashi K, de Laey JJ. Indocyanine green angiography of choroidal neovascular membranes. Ophthalmologica. 1985;190:30-39.
Hayashi K, Hasegawa Y, Tokoro T. Indocyanine green angiography of central serous chorioretinopathy. Int Ophthalmol. 1986;9:37-41.
Hayashi K, Hasegawa Y, Tazawa Y, de Laey JJ. Clinical application of indocyanine green angiography to choroidal neovascularization. Jpn J Ophthalmol. 1989;33:57-65.
Guyer DR, Puliafito CA, Monés JM, Friedman E, Chang W, Verdooner SR. Digital indocyanine-green angiography in chorioretinal disorders. Ophthalmology. 1992;99:287-291.
Yannuzzi LA, Slakter JS, Sorenson JA, Guyer DR, Orlock DA. Digital indocyanine green videoangiography and choroidal neovascularization. Retina. 1992;12:191-223.
De Laey JJ. Diagnosis and differential diagnosis of malignant melanomas of the choroid. Bull Soc Belge Ophtalmol. 1993;248:6-10.
Arevalo JF, Shields CL, Shields JA, Hykin PG, De Potter P. Circumscribed choroidal hemangioma: characteristic features with indocyanine green videoangiography. Ophthalmology. 2000;107:344-350.
Slakter JS, Giovannini A, Yannuzzi LA, Scassellati-Sforzolini B, Guyer DR, Sorenson JA, Spaide RF, Orlock D. Indocyanine green angiography of multifocal choroiditis. Ophthalmology. 1997;104:1813-1819.
Sallet G, Amoaku WM, Lafaut BA, Brabant P, De Laey JJ. Indocyanine green angiography of choroidal tumors. Graefes Arch Clin Exp Ophthalmol. 1995;233:677-689.
Wessing A. Fluoressein angiography of the retina.Texbook and atlas. St. Louis, C.V- Mosby, 1969:13.
Cherrick GR, Stein SW, Leevy CM, Davidson CS. Indocyanine green: observations on its physical properties, plasma decay and hepatic extraction. J Clin Invest. 1960;39:592-600.
Geeraets WJ, Berry ER. Ocular spectral characteristics as related to hazards from lasers and other light sources. Am J Ophthalmol. 1968;66:15-20.
Scheider A. Diagnostic der Aderhaut mit dem Scanning-Laser-Ophthalmoskop und Indozyanine-Grün. In: Laser Kampik A, ed. Biermann Verlag, Zülpich,1992:47-54.
Yannuzzi LA, Rohrer KT, Tindel LJ, Sobel RS, Costanza MA, Shields W, Zang E. Fluorescein angiography complication survey. Ophthalmology. 1986;93:611-617.
Hope-Ross M, Yannuzzi LA, Gragoudas ES, Guyer DR, Slakter JS, Sorenson JA, Krupsky S, Orlock DA, Puliafito CA. Adverse reactions due to indocyanine green. Ophthalmology. 1994;101:529-533.
Obana A, Miki T, Hayashi K, Takeda M, Kawamura A, Mutoh T, Harino S, Fukushima I, Komatsu H, Takaku Y, Shiraga F, Matsuhashi H, Torii Y, Masaoka N, Kondoh T, Hasegawa Y. Survey of complications of indocyanine green angiography in Japan. Am J Ophthalmol. 1994;118:749-753.
Krohne TU. Medizinische Mythen in der Augenheilkunde [Medical myths in ophthalmology]. Ophthalmologe. 2016;113:1009.
Huang SW. Seafood and iodine: an analysis of a medical myth. Allergy Asthma Proc. 2005;26:468-469.
Meira J, Marques ML, Falcão-Reis F, Rebelo Gomes E, Carneiro Â. Immediate Reactions to Fluorescein and Indocyanine Green in Retinal Angiography: Review of Literature and Proposal for Patient’s Evaluation. Clin Ophthalmol. 2020;14:171-178.
Wolf S, Arend O, Schulte K, Reim M. Severe anaphylactic reaction after indocyanine green fluorescence angiography. Am J Ophthalmol. 1992;114:638-639.
Bonte CA, Ceuppens J, Leys AM. Hypotensive shock as a complication of infracyanine green injection. Retina. 1998;18:476-477.
Wang X, Zhang Y, Yang H, Xu Y. Maternal-fetal transfer of indocyanine green: a systematic review. J Matern Fetal Neonatal Med. 2022;35:8181-8185.
Soubrane G, Seres A, Coscas G, Flower RW. Suggested terminology for different phases of indocyanine green angiogram. Retina. 2000;20:319-320.
Guyer DR, Yannuzzi LA, Slakter JS, Sorenson JA, Hanutsaha P, Spaide RF, Schwartz SG, Hirschfeld JM, Orlock DA. Classification of choroidal neovascularization by digital indocyanine green videoangiography. Ophthalmology. 1996;103:2054-2060.
Guyer DR, Yannuzzi LA, Ladas I, Slakter JS, Sorenson JA, Orlock D. Indocyanine green-guided laser photocoagulation of focal spots at the edge of plaques of choroidal neovascularization. Arch Ophthalmol. 1996;114:693-697.
Staurenghi G, Orzalesi N, La Capria A, Aschero M. Laser treatment of feeder vessels in subfoveal choroidal neovascular membranes: a revisitation using dynamic indocyanine green angiography. Ophthalmology. 1998;105:2297-2305.
Spaide RF, Yannuzzi LA, Slakter JS, Sorenson J, Orlach DA. Indocyanine green videoangiography of idiopathic polypoidal choroidal vasculopathy. Retina. 1995;15:100-110.
Fernandes LH, Freund KB, Yannuzzi LA, Spaide RF, Huang SJ, Slakter JS, Sorenson JA. The nature of focal areas of hyperfluorescence or hot spots imaged with indocyanine green angiography. Retina. 2002;22:557-568.
Spaide RF, Gemmy Cheung CM, Matsumoto H, Kishi S, Boon CJF, van Dijk EHC, Mauget-Faysse M, Behar-Cohen F, Hartnett ME, Sivaprasad S, Iida T, Brown DM, Chhablani J, Maloca PM. Venous overload choroidopathy: A hypothetical framework for central serous chorioretinopathy and allied disorders. Prog Retin Eye Res. 2022;86:100973.
Spaide RF, Campeas L, Haas A, Yannuzzi LA, Fisher YL, Guyer DR, Slakter JS, Sorenson JA, Orlock DA. Central serous chorioretinopathy in younger and older adults. Ophthalmology. 1996;103:2079-2080.
Herbort CP Jr, Tugal-Tutkun I, Mantovani A, Neri P, Khairallah M, Papasavvas I. Advances and potential new developments in imaging techniques for posterior uveitis Part 2: invasive imaging methods. Eye (Lond). 2021;35:52-73.
Shields CL, Shields JA, De Potter P. Patterns of indocyanine green videoangiography of choroidal tumours. Br J Ophthalmol. 1995;79:237-245.